Fig. 9.
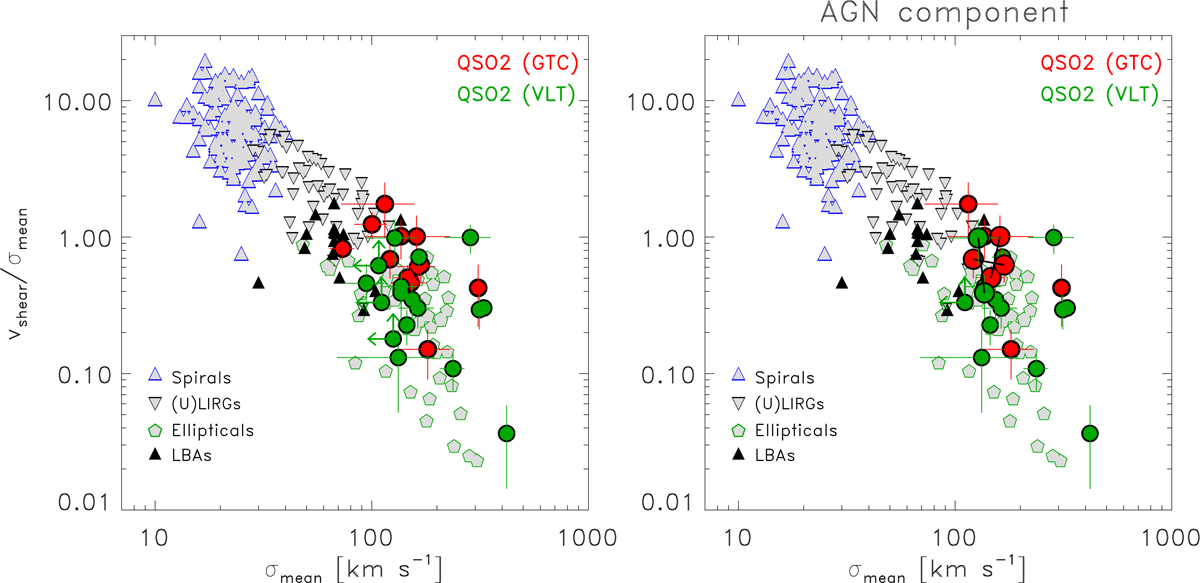
Dynamical state of the galaxies. Relationship between the observed dynamical ratio, vshear/σmean, and the mean velocity dispersion, σmean for all galaxies isolated in the GTC (red) and VLT (green) samples (left). Only the AGN host galaxies are shown in the right panel. When two locations are available for the same AGN host (derived from the two spectra obtained with different slit PAs), these are joined by a solid black line. The blue–contoured triangles represent spiral GHASP galaxies (Epinat et al. 2010), green–contoured pentagons show E/SO objects (Cappellari et al. 2007), black–contoured top-down empty triangles show (U)LIRGs (B13), and black filled triangles indicate LBAs (Gonçalves et al. 2010). For the spirals the v parameter is defined as the maximum amplitude of the rotational curve within the extent of the velocity field along the major axis, and σ is the average of the velocity dispersion map. For E/S0, v and σ are luminosity–weighted square quantities that we derived from the stellar velocity field and velocity dispersion maps, respectively (see details in Cappellari et al. 2007). For the (U)LIRGs, the velocity shear and mean velocity dispersion were computed as in this work (a slightly different percentile was used in B13 to derive the vshear). For the LBAs, the velocity shear was defined as in B13, while the velocity dispersion is the flux–weighted mean value.
Current usage metrics show cumulative count of Article Views (full-text article views including HTML views, PDF and ePub downloads, according to the available data) and Abstracts Views on Vision4Press platform.
Data correspond to usage on the plateform after 2015. The current usage metrics is available 48-96 hours after online publication and is updated daily on week days.
Initial download of the metrics may take a while.