Fig. 7.
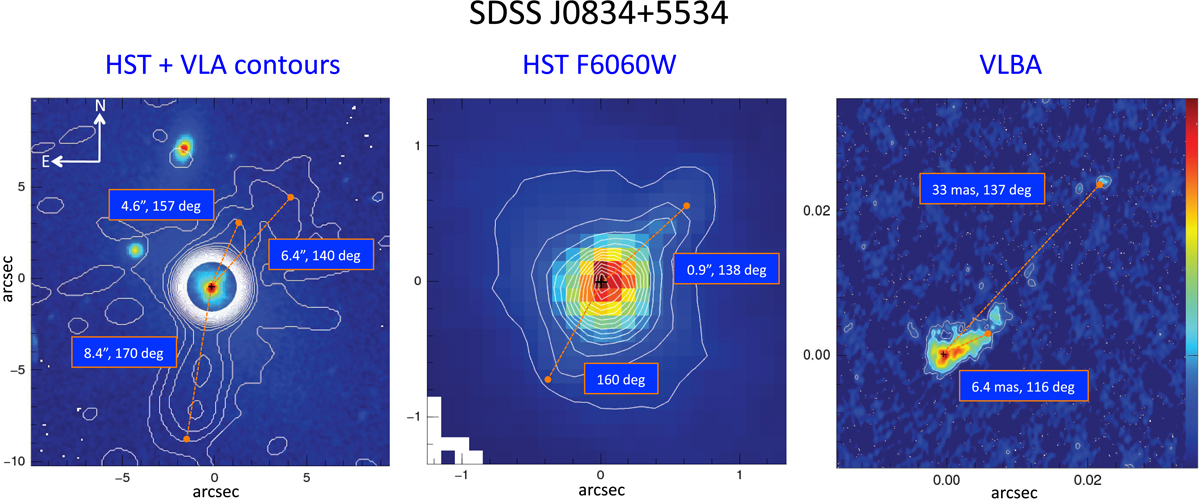
Comparison between the optical HST and the radio VLA and VLBA images of SDSS 0834+5534. The position angles (north to east) of the different structures (optical and radio) and their respective extensions in arcsec are shown. The spatial centroid of the HST image has been aligned the VLA peak emission (black cross). Left: HST F606W image with the VLA contours overplotted (in white; also shown in Fig. 1; ∼20″ × 20″ or 75 kpc × 75 kpc). Middle: HST image (∼2″ × 2″ or or 7.5 kpc × 7.5 kpc) and its contours. Right: VLBA image of the very inner regions of the object with its contours (∼0.04″ × 0.04″ or 0.15 kpc × 0.15 kpc). Its intensity peak overlaps with the VLA peak (black cross).
Current usage metrics show cumulative count of Article Views (full-text article views including HTML views, PDF and ePub downloads, according to the available data) and Abstracts Views on Vision4Press platform.
Data correspond to usage on the plateform after 2015. The current usage metrics is available 48-96 hours after online publication and is updated daily on week days.
Initial download of the metrics may take a while.