Fig. 4.
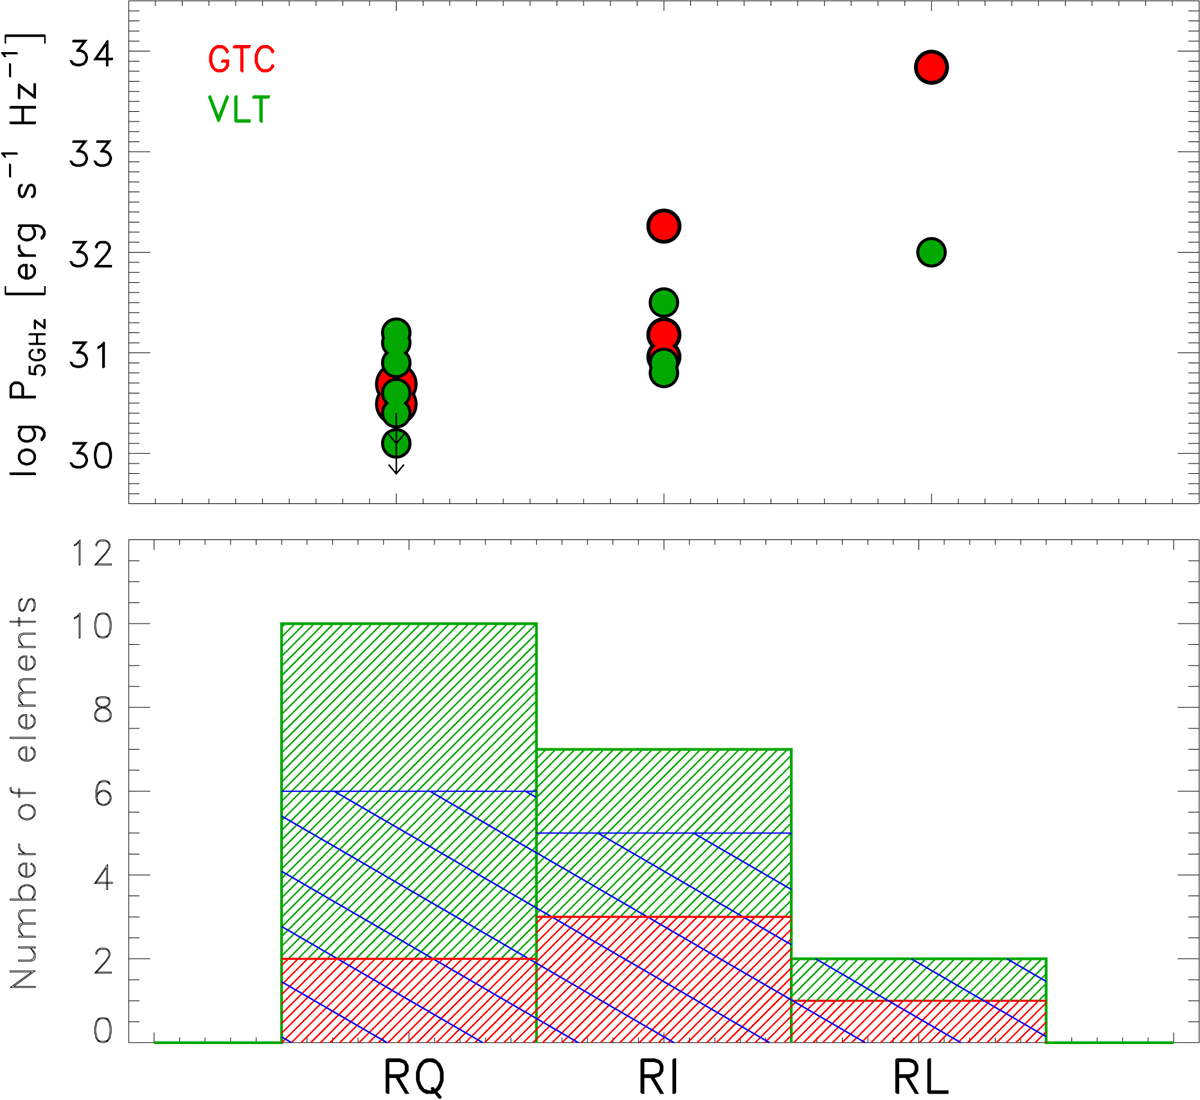
Top: distribution of the objects of the GTC and VLT samples in the radio power at 5 GHz (logarithmic scale) – radio-loudness plane (i.e., radio-quiet (RQ), intermediate (RI), and loud (RL), see text). The GTC (red) and the VLT (green) objects are considered. Bottom: number of elements in each radio-loudness bin, identified according to their respective color code. The number of objects with confirmed or indirect evidence for extended radio emission on scales larger than 5″ is indicated with the dashed blue lines.
Current usage metrics show cumulative count of Article Views (full-text article views including HTML views, PDF and ePub downloads, according to the available data) and Abstracts Views on Vision4Press platform.
Data correspond to usage on the plateform after 2015. The current usage metrics is available 48-96 hours after online publication and is updated daily on week days.
Initial download of the metrics may take a while.