Fig. A.1.
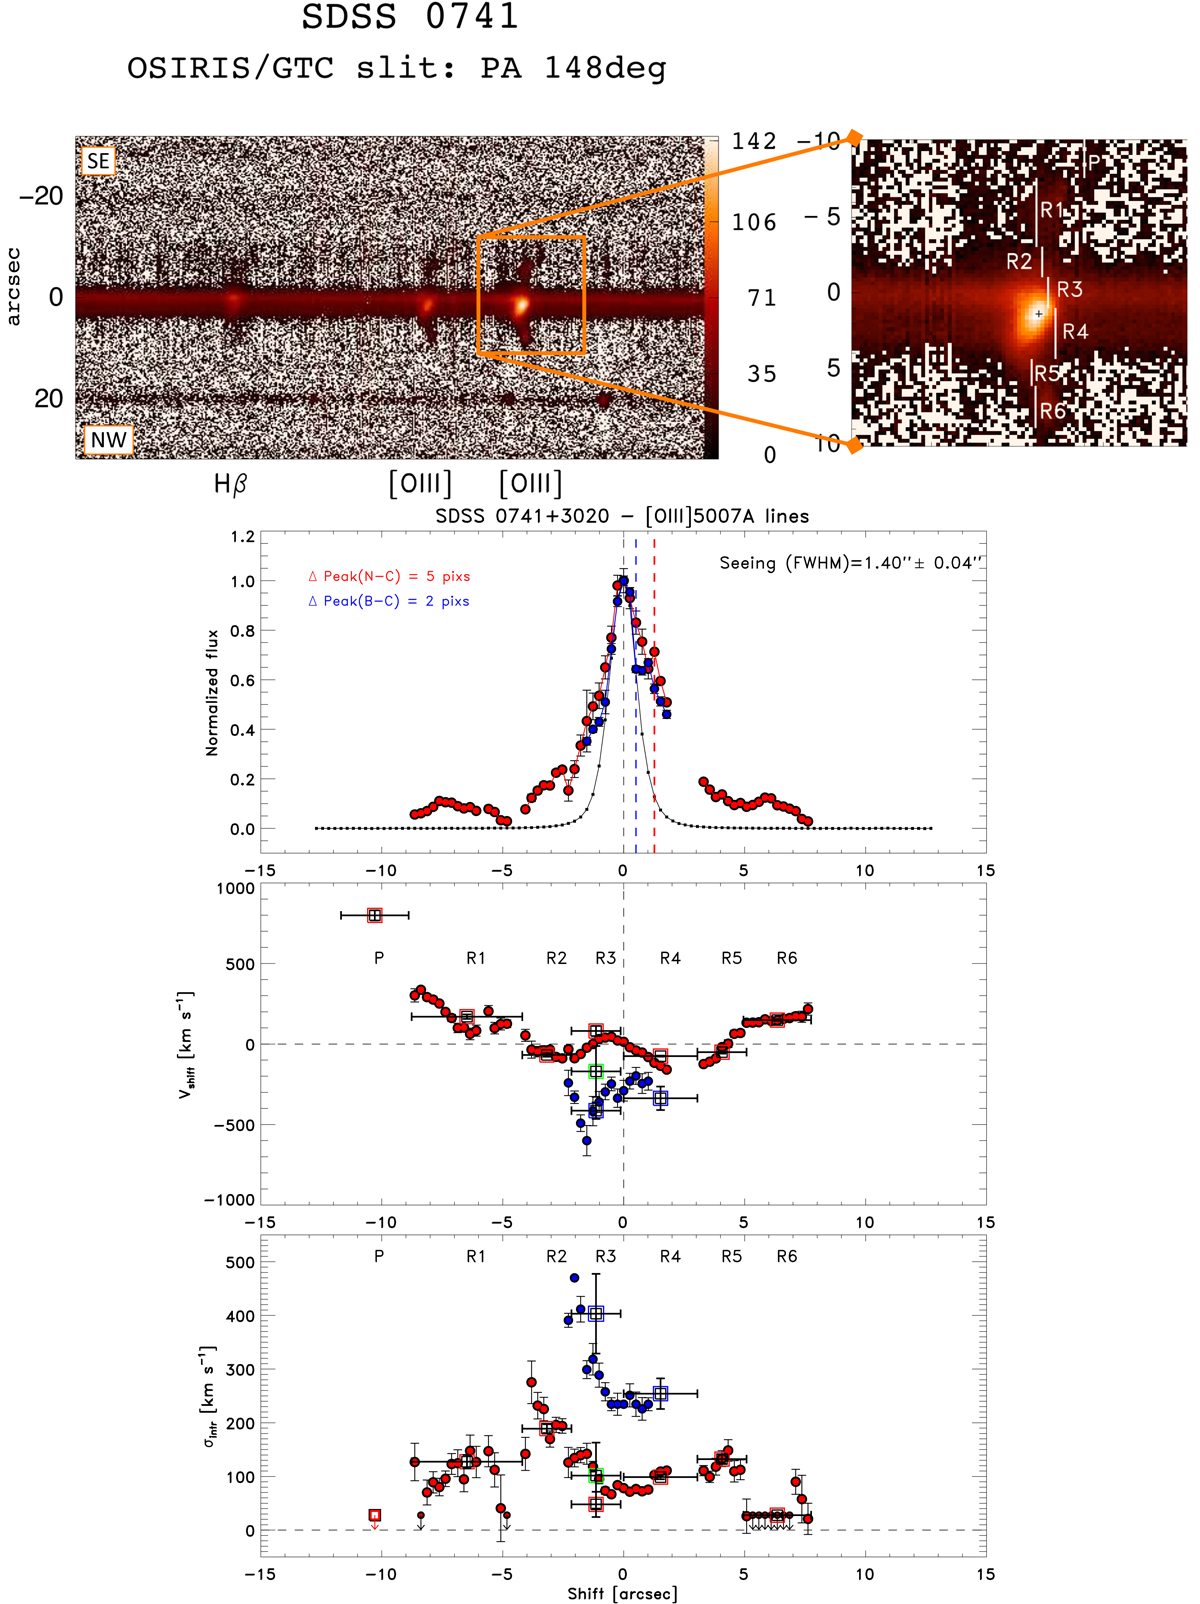
SDSS 0741+3020. Top panel, left: 2–dim spectrum covering the Hβ and [OIII]λλ4959,5007 lines along the slit PA. The colored bar spans the scale between the minimum and maximum fluxes in units of 10−19 erg s−1 cm−2 pix−1. Right: zoom-in around [OIII]λ5007 highlighting all spatial regions considered in the kinematic analysis (R1, R2, etc). The spatial location of the narrow component flux peak is shown with a black cross. The spatial zero in all panels is assumed to coincide with the continuum spatial centroid (i.e., the location of the peak of the continuum). Bottom panel: spatial distribution and kinematic properties of the individual kinematic components identified in the [OIII] doublet. Top: spatial distribution of the continuum-subtracted line flux. The spatial profile of each kinematic component has been shifted and centered with the seeing profile to facilitate visual comparison. The spatial zero marks the location of the continuum peak. The line spatial centroid is assumed to coincide with the location of the line peak. The true shift between the line spatial centroid of a given kinematic component and the spatial zero (e.g., Δ Peak(N–C)) is shown with dashed vertical lines maintaining the same color–code. Each kinematic component is identified in this panel with N (narrow), B (broad), or other, as explained in the main text for each object. Middle: velocity field (i.e., velocity shift computed relative to the systemic velocity; see Sect. 4.2). Bottom: intrinsic velocity dispersion. Upper limits on the velocity dispersion are shown for spectrally unresolved lines. The results of the pixel-to-pixel analysis are shown with solid circles. No spatial shift has been applied to the velocity field and velocity dispersion. Red and blue are used for the systemic (narrow) and for the broad components, respectively. When a third component is isolated, green is used. The results of the analysis based on the spectra integrated within larger apertures (P, R1, R2, etc.) are shown with large open square symbols, using the same color-code as in the pixel-to-pixel analysis.
Current usage metrics show cumulative count of Article Views (full-text article views including HTML views, PDF and ePub downloads, according to the available data) and Abstracts Views on Vision4Press platform.
Data correspond to usage on the plateform after 2015. The current usage metrics is available 48-96 hours after online publication and is updated daily on week days.
Initial download of the metrics may take a while.