Fig. 10.
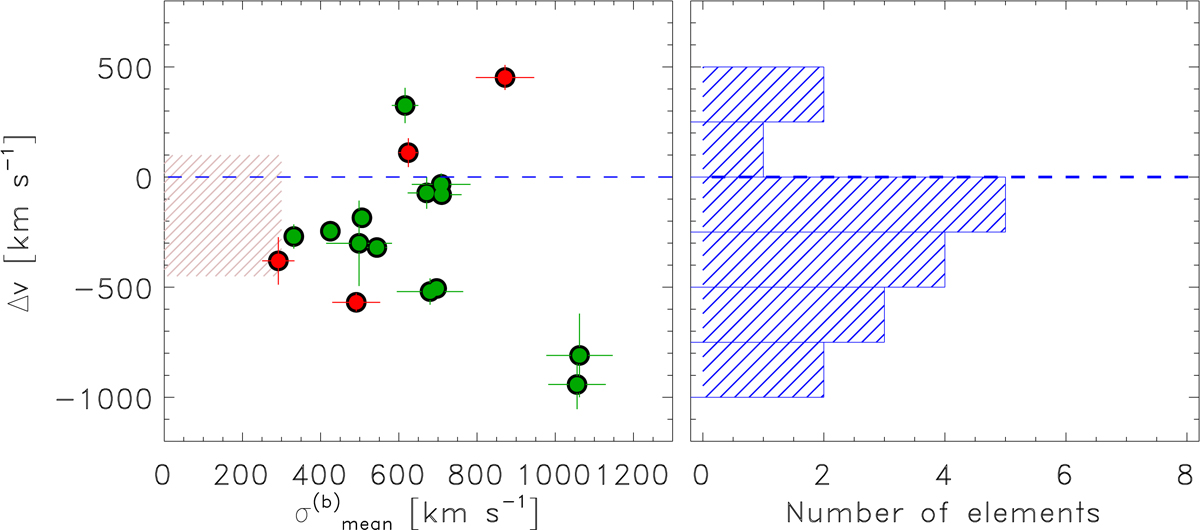
Velocity shift, Δv, between the broad and narrow components vs. the mean velocity dispersion of the broad component, ![]() . The horizontal dashed line indicates the zero-velocity shift. Most of the objects show a blueshifted (negative values) broad component, most of them clustered around Δv = 0 to −500 km s−1. The dashed red region represents the typical values covered by a local sample of (U)LIRGs studied by B13. The color code is the same as in Fig. 9.
. The horizontal dashed line indicates the zero-velocity shift. Most of the objects show a blueshifted (negative values) broad component, most of them clustered around Δv = 0 to −500 km s−1. The dashed red region represents the typical values covered by a local sample of (U)LIRGs studied by B13. The color code is the same as in Fig. 9.
Current usage metrics show cumulative count of Article Views (full-text article views including HTML views, PDF and ePub downloads, according to the available data) and Abstracts Views on Vision4Press platform.
Data correspond to usage on the plateform after 2015. The current usage metrics is available 48-96 hours after online publication and is updated daily on week days.
Initial download of the metrics may take a while.