Fig. 1.
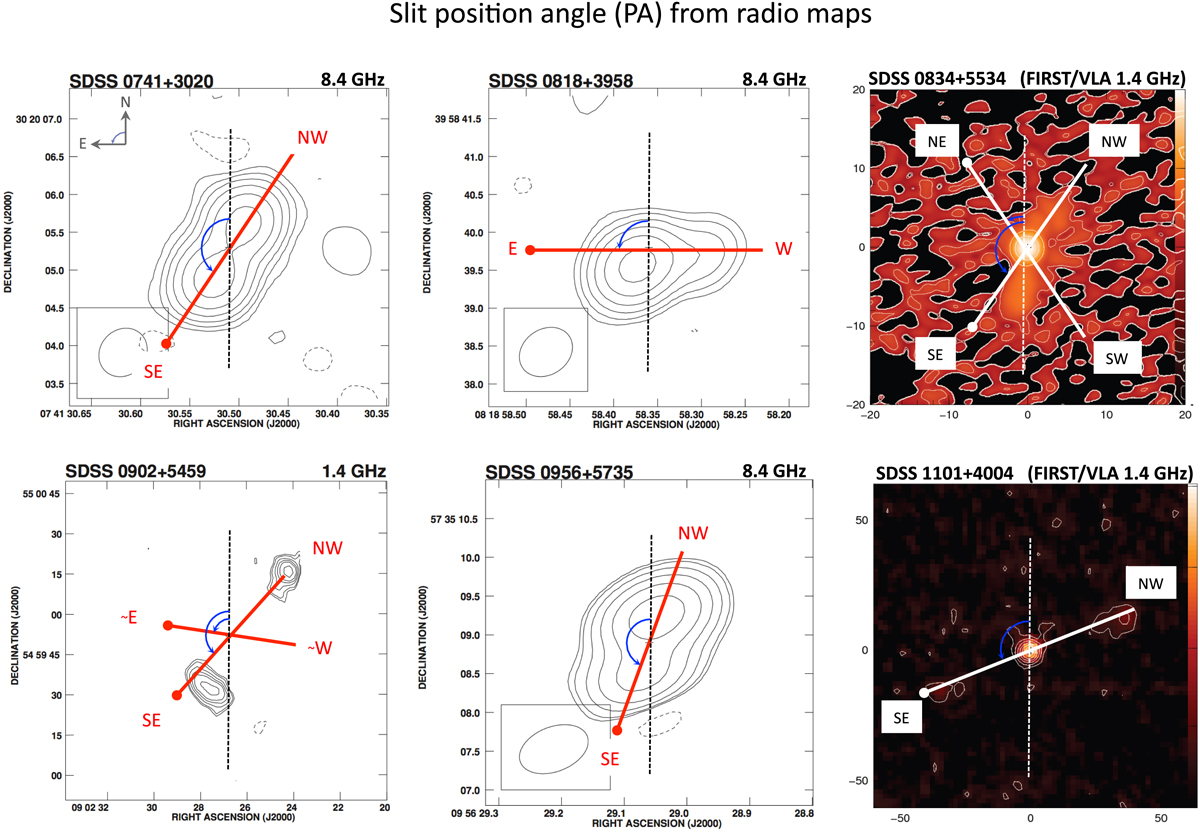
Very Large Array radio maps (at 1.4 GHz (FIRST) and 8.4 GHz) of the GTC sample. Four sources (SDSS 0741+3020, SDSS 0818+3958, SDSS 0902+5459, and SDSS 0956+5735) have previously been published in Lal & Ho (2010). FIRST/VLA images for SDSS 0834+5534 and SDSS 1101+4004 have been obtained from the archive. All objects show extended radio emission. The positions of the slit used in the GTC spectroscopic observations are shown in red, except for two sources (SDSS 0834+5534 and SDSS 1101+4004), which are shown in white. The PA are shown in Table 1 (Col. 2). For each object, at least one PA was chosen along the main axis of the radio structures.
Current usage metrics show cumulative count of Article Views (full-text article views including HTML views, PDF and ePub downloads, according to the available data) and Abstracts Views on Vision4Press platform.
Data correspond to usage on the plateform after 2015. The current usage metrics is available 48-96 hours after online publication and is updated daily on week days.
Initial download of the metrics may take a while.