Fig. 9
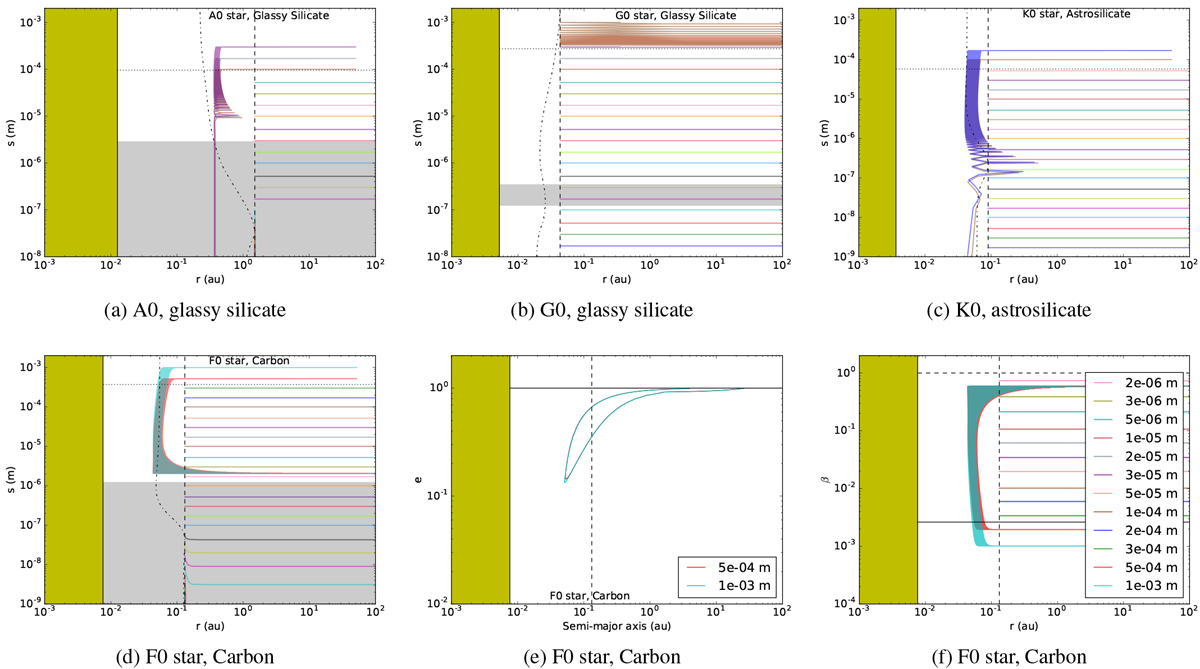
Panels a–c: grain size as function of the distance for all simulations run in the exocometary dust delivery at perihelion scenario (the yellow area, and the dotted and dash-dotted lines have the same meaning as in Fig. 2, while the dashed line corresponds to the limit between initially bound and unbound grains sizes). Panels d–f: specific case of an F0 star and carbon grains, for which the evolution of the grain size, the eccentricity, and the β value as a function of distance is displayed. In the case of eccentricity, the two curves overlap.
Current usage metrics show cumulative count of Article Views (full-text article views including HTML views, PDF and ePub downloads, according to the available data) and Abstracts Views on Vision4Press platform.
Data correspond to usage on the plateform after 2015. The current usage metrics is available 48-96 hours after online publication and is updated daily on week days.
Initial download of the metrics may take a while.