Fig. A.1.
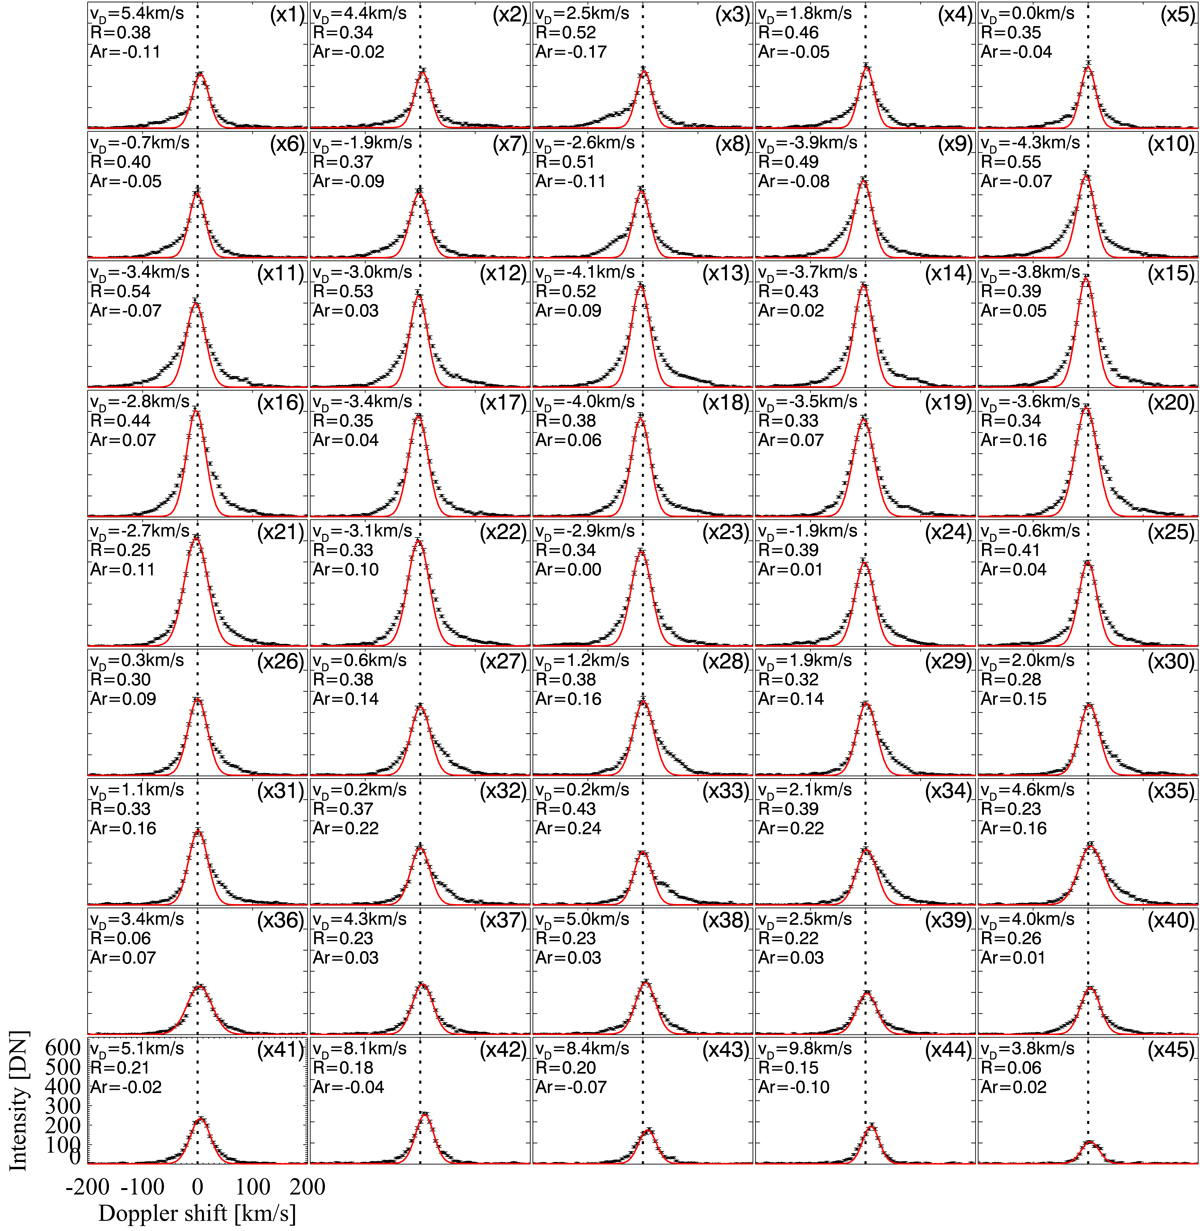
Same as Fig. 4, but for the positions two spatial pixels below (south of) the pixels where the Si IV (1394 Å) spectra in Fig. 4 are taken. This essentially follows the southern edge of the loop. The central axis of the loop is shown in Fig. 1b. The diamonds (with the bars) show the observed spectra, and the red lines indicate single-Gaussian fits to the line core. The parameters denoted by the numbers in the plots show the line centroid (vD) of the red fits, the total residual of the intensity (R), and the red-blue asymmetry (Ar).
Current usage metrics show cumulative count of Article Views (full-text article views including HTML views, PDF and ePub downloads, according to the available data) and Abstracts Views on Vision4Press platform.
Data correspond to usage on the plateform after 2015. The current usage metrics is available 48-96 hours after online publication and is updated daily on week days.
Initial download of the metrics may take a while.