Fig. 7.
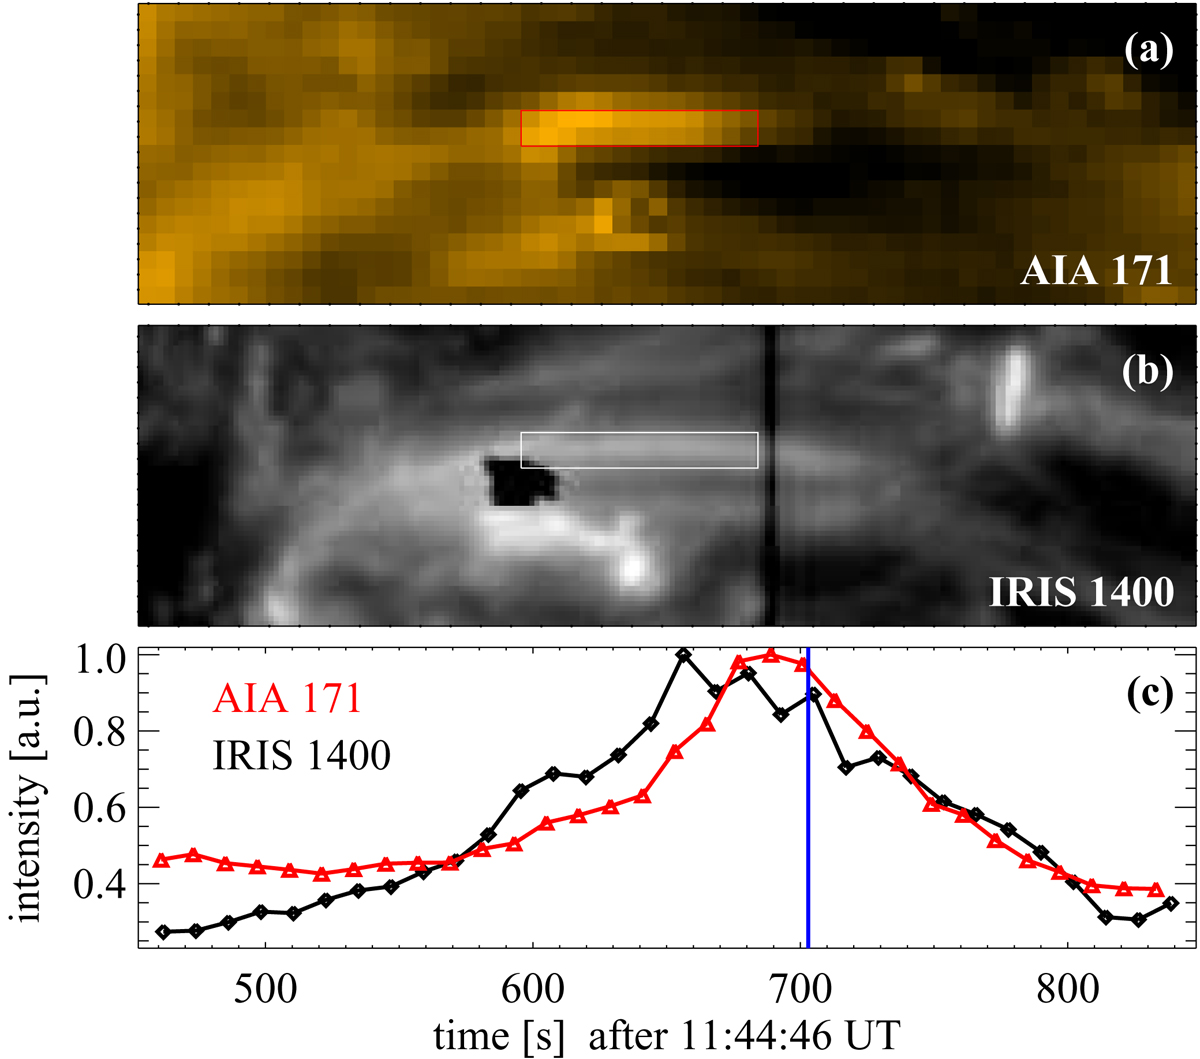
Temporal evolution of the loop intensity. Panels a and b: snapshots in the AIA 171 Å channel and the IRIS slit-jaw images at 1400 Å. The field of view is the same as in Fig. 1, but here we use a logarithmic scaling of the intensities. The apex region of the loop under investigation here is indicated by the boxes in panels a and b. Panel c: intensity integrated over the box in the two channels. The vertical blue line shows the time of the snapshots in panels a and b. The black vertical line in panel b is the spectrograph slit, the black feature at the bottom left edge of the box in panel b is an artifact on the detector. An animation showing the temporal evolution while the slit is passing the loop is available online. See Sect. 4.4.
Current usage metrics show cumulative count of Article Views (full-text article views including HTML views, PDF and ePub downloads, according to the available data) and Abstracts Views on Vision4Press platform.
Data correspond to usage on the plateform after 2015. The current usage metrics is available 48-96 hours after online publication and is updated daily on week days.
Initial download of the metrics may take a while.