Fig. 6.
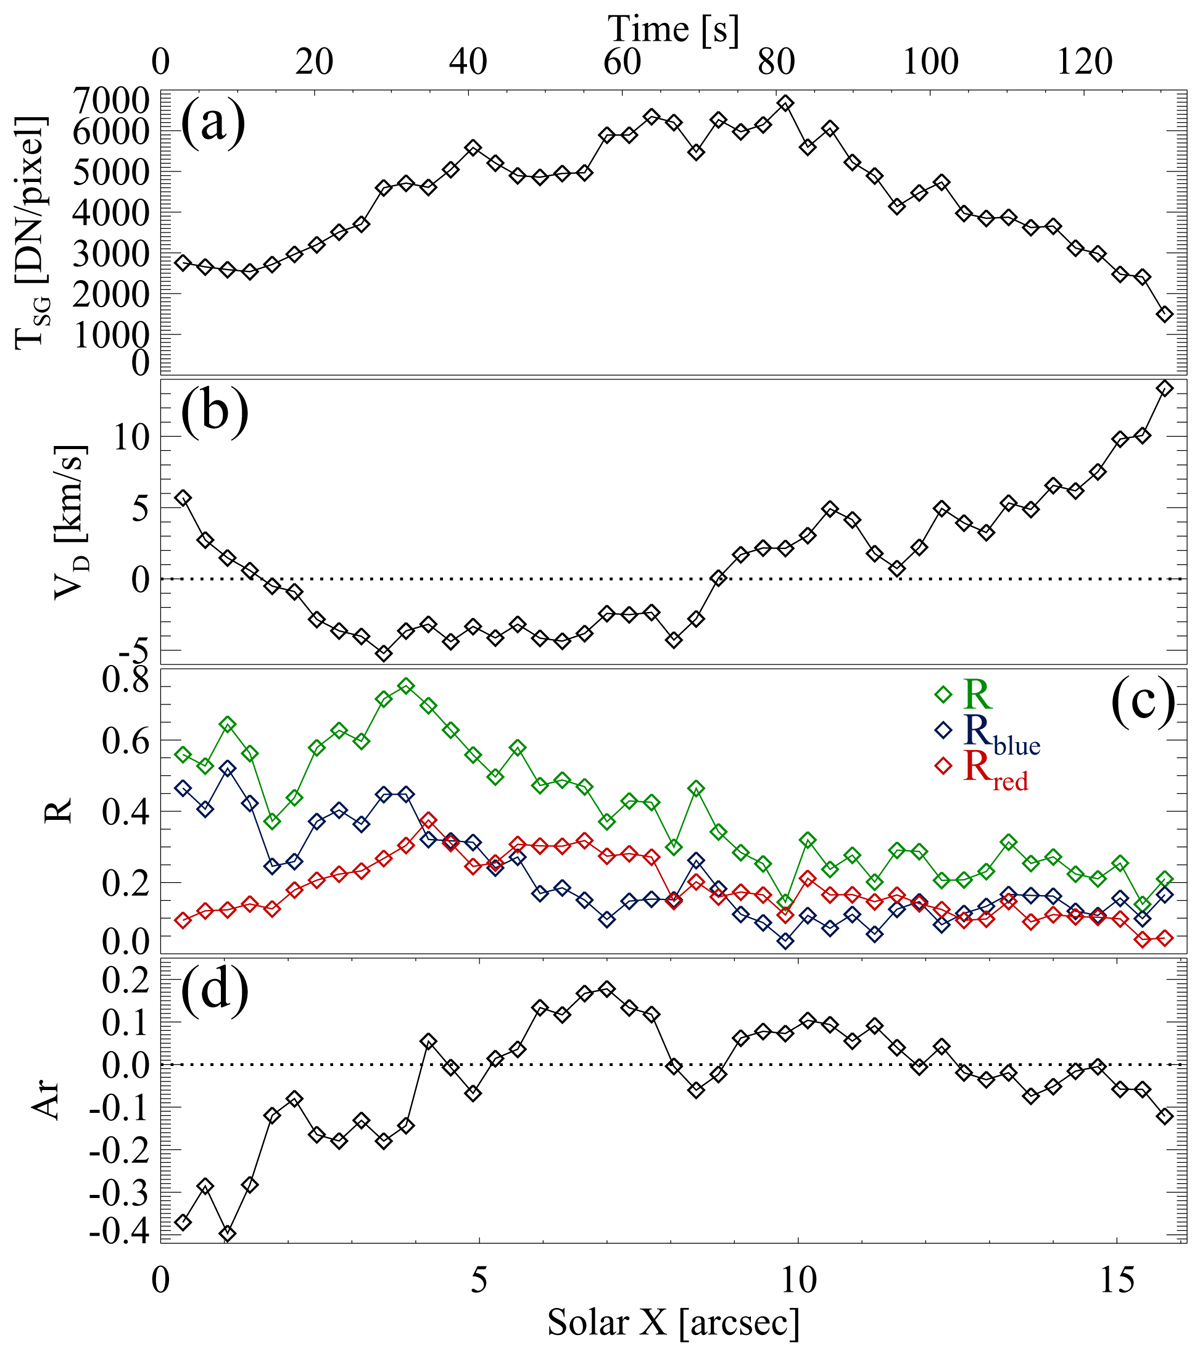
Evolution of the line profile characteristics of Si IV (1394 Å) along the loop. Panels a and b: total intensity (TSG) and Doppler shift (vD) of the single-Gaussian fits to the line core. Panel c: residuals of the intensity in the blue wing (Rblue), the red wing (Rred), and over the whole line (R) as defined in Eqs. (1)–(3). Panel d: red-blue asymmetry (Ar) as defined in Eq. (4). Because we follow a parcel of gas that moves along the loop, the top axis shows the time to indicate the temporal evolution. See Sect. 3.5.
Current usage metrics show cumulative count of Article Views (full-text article views including HTML views, PDF and ePub downloads, according to the available data) and Abstracts Views on Vision4Press platform.
Data correspond to usage on the plateform after 2015. The current usage metrics is available 48-96 hours after online publication and is updated daily on week days.
Initial download of the metrics may take a while.