Fig. 5.
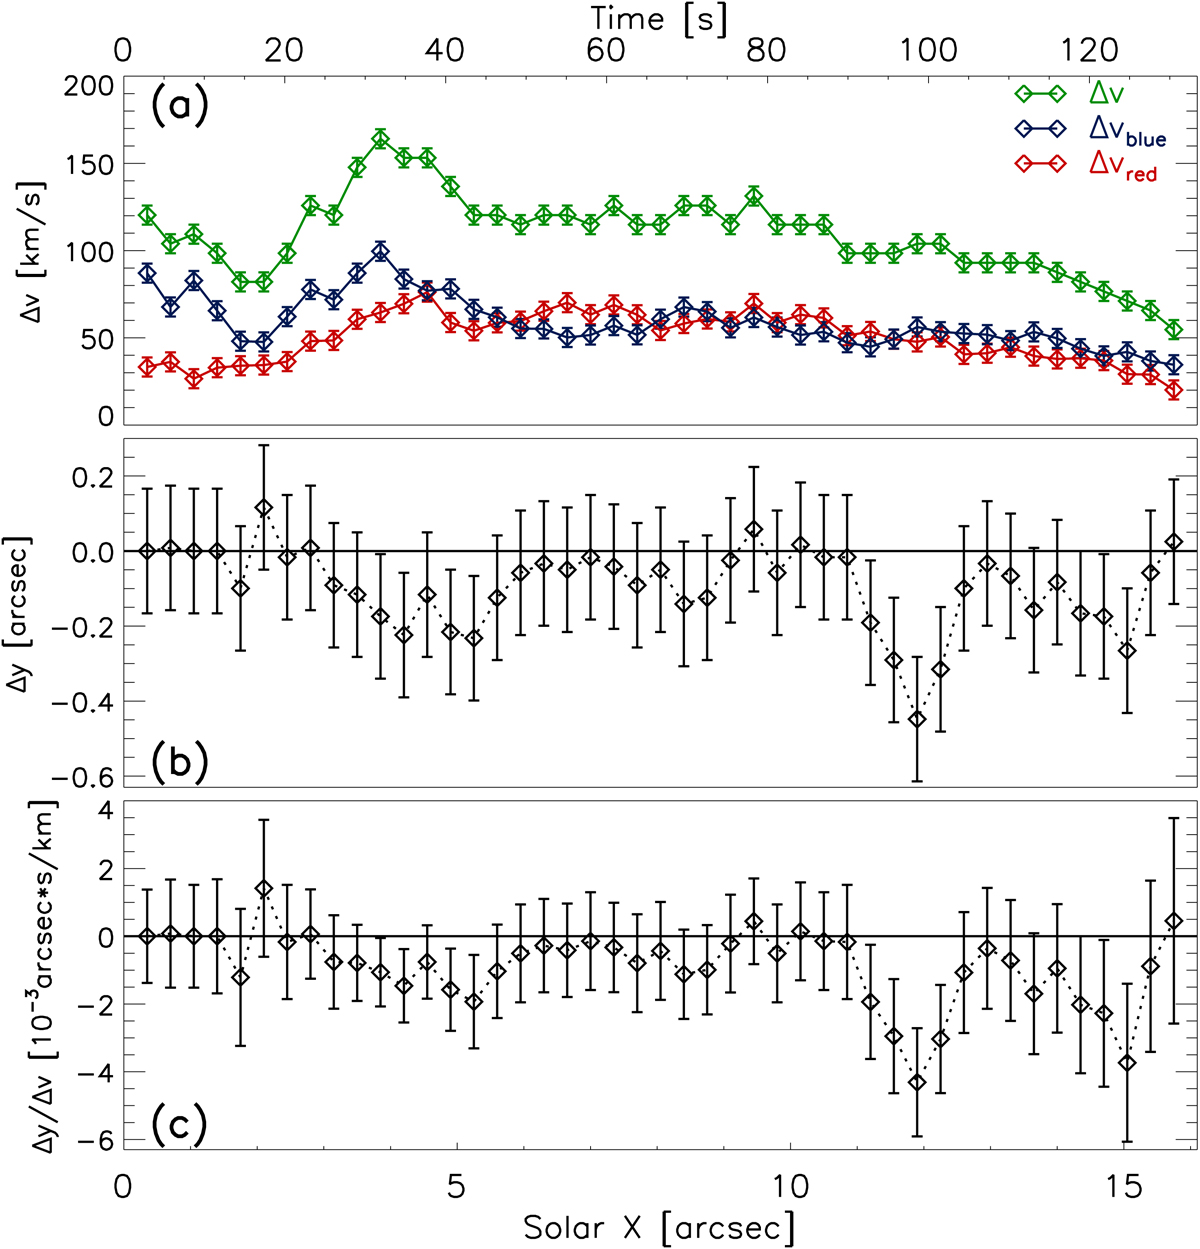
Evolution of the spectral tilt of Si IV (1394 Å) along the loop. Panel a: Doppler dispersion separately for the blue wing (Δvblue), the red wing (Δvred), and a combination of both wings (Δv). Panel b: offset between the maximum enhancements in the blue and red wings along the slit (Δy). The errors are conservatively estimated to be ±1 spatial pixel. Panel c: spectral tilt (Δy/Δv). Because we follow a parcel of gas moving along the loop, the top axis shows the time to indicate the temporal evolution. See Sect. 3.4.
Current usage metrics show cumulative count of Article Views (full-text article views including HTML views, PDF and ePub downloads, according to the available data) and Abstracts Views on Vision4Press platform.
Data correspond to usage on the plateform after 2015. The current usage metrics is available 48-96 hours after online publication and is updated daily on week days.
Initial download of the metrics may take a while.