Fig. 4.
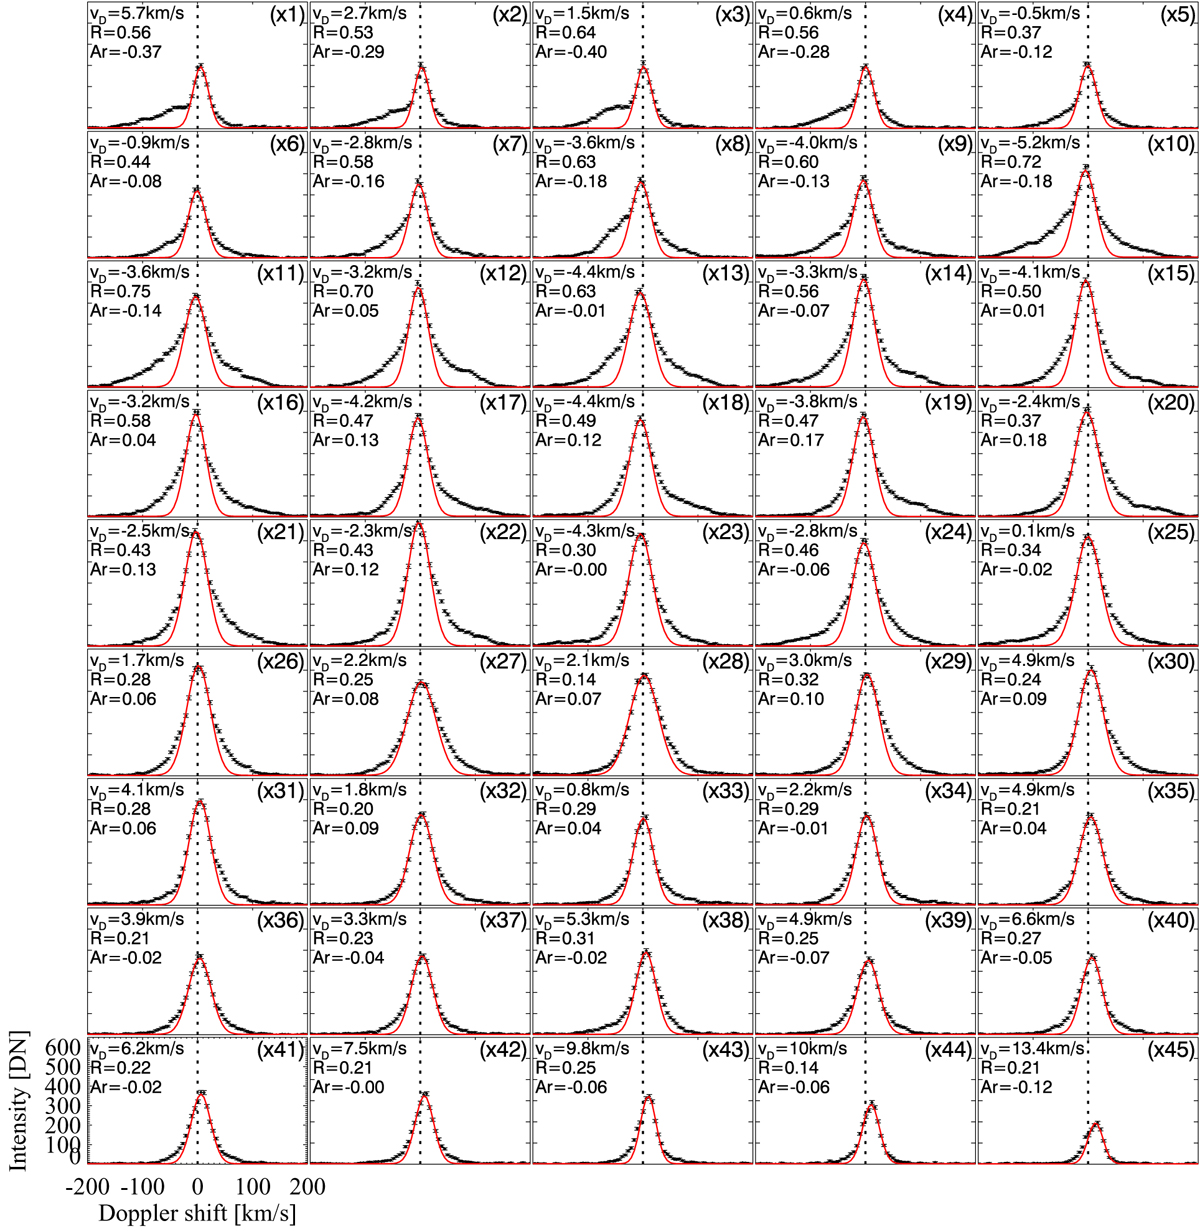
Individual spectral profiles of Si IV (1394 Å) along the loop. Each profile was recorded in one spatial pixel on the central axis of the loop (i.e., maximum emission from the loop at the respective slot position; dotted line in Fig. 1b). These are the spectral profiles at the locations of the short horizontal white markers in the detector images from Fig. 3. The diamonds (with the bars) show the observed spectra and the red lines indicate single-Gaussian fits to the line core. To ensure that the single-Gaussian fits only represent the line core, the fit was performed only within ±20 km s−1 from the peak of the line. The parameters denoted by the numbers in the plots show the line centroid (vD) of the red fits, the total residual of the intensity (R), and the red-blue asymmetry (Ar). See Sects. 3.3 and 3.5.
Current usage metrics show cumulative count of Article Views (full-text article views including HTML views, PDF and ePub downloads, according to the available data) and Abstracts Views on Vision4Press platform.
Data correspond to usage on the plateform after 2015. The current usage metrics is available 48-96 hours after online publication and is updated daily on week days.
Initial download of the metrics may take a while.