Fig. 3.
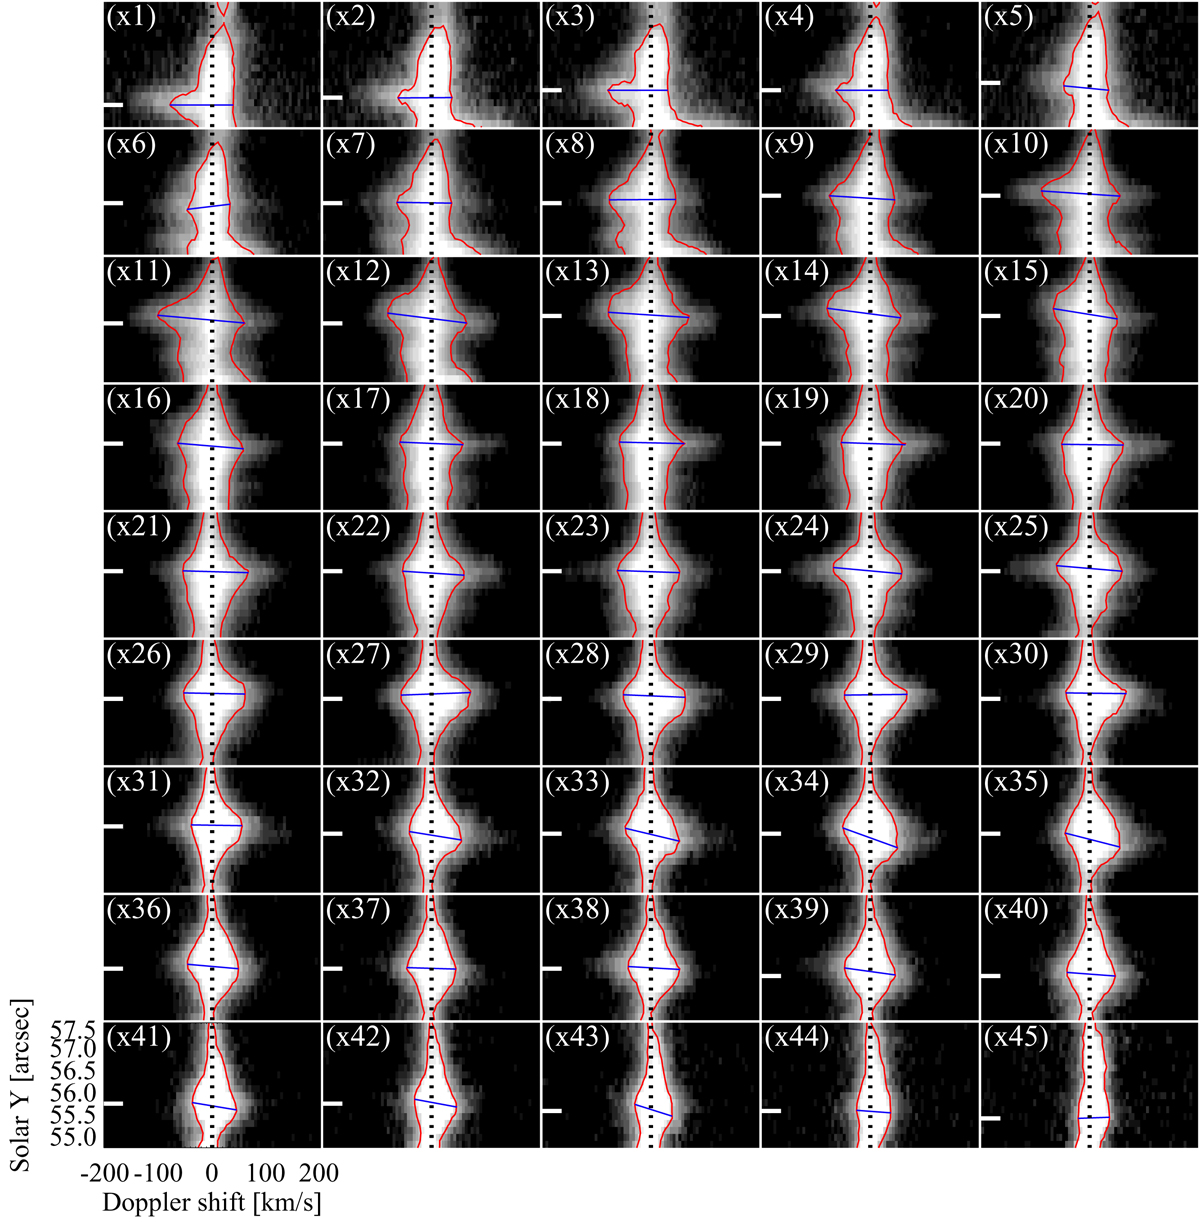
Spectral detector images of Si IV (1394 Å) along the loop. The 45 raster steps from the eastern to the western footpoint in Fig. 1 are labeled x1 through x45. The locations of x3, x13, etc., and x43 are marked in Fig. 1b by five blue vertical lines. The white markers indicate the location of the central axis of the loop as displayed by the dotted line in Fig. 1b. The vertical dotted lines indicate zero Doppler shift. The red curves show the contours of the respective spectra at a level of 18% of its maximum. The blue lines connect two positions with the maximum enhancements in the blue and red wings. See Sects. 3.3 and 3.4.
Current usage metrics show cumulative count of Article Views (full-text article views including HTML views, PDF and ePub downloads, according to the available data) and Abstracts Views on Vision4Press platform.
Data correspond to usage on the plateform after 2015. The current usage metrics is available 48-96 hours after online publication and is updated daily on week days.
Initial download of the metrics may take a while.