Fig. 2.
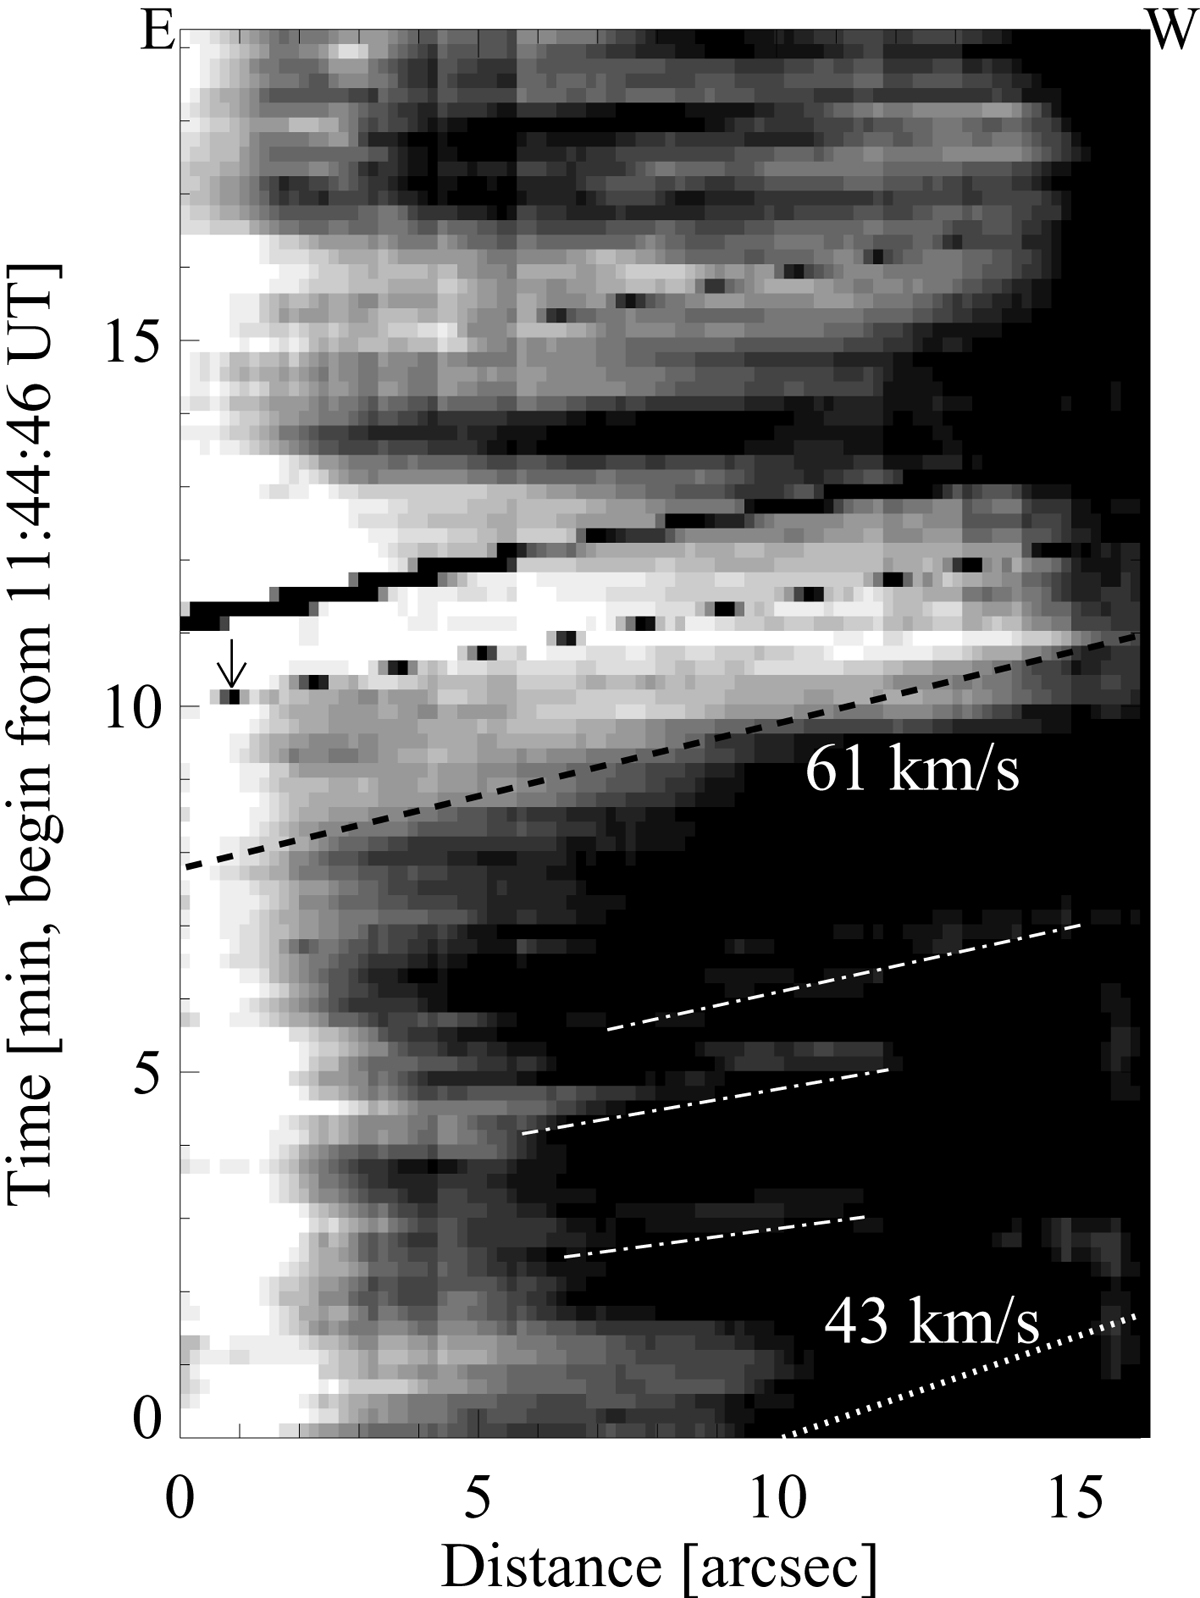
Proper motions along the loop. A space-time plot of a series of IRIS slit-jaw images in the 1400 Å channel along the dotted line EW as marked in Fig. 1. The dashed line and dash-dotted lines indicate proper motions along the loop. For comparison, the dotted line shows the sound speed near 80 000 K in the line formation region of Si IV. The respective mean velocity is denoted by the numbers in the plot. The black arrow marks the IRIS slit that scanned the loop. See Sect. 3.2.
Current usage metrics show cumulative count of Article Views (full-text article views including HTML views, PDF and ePub downloads, according to the available data) and Abstracts Views on Vision4Press platform.
Data correspond to usage on the plateform after 2015. The current usage metrics is available 48-96 hours after online publication and is updated daily on week days.
Initial download of the metrics may take a while.