Fig. A.3.
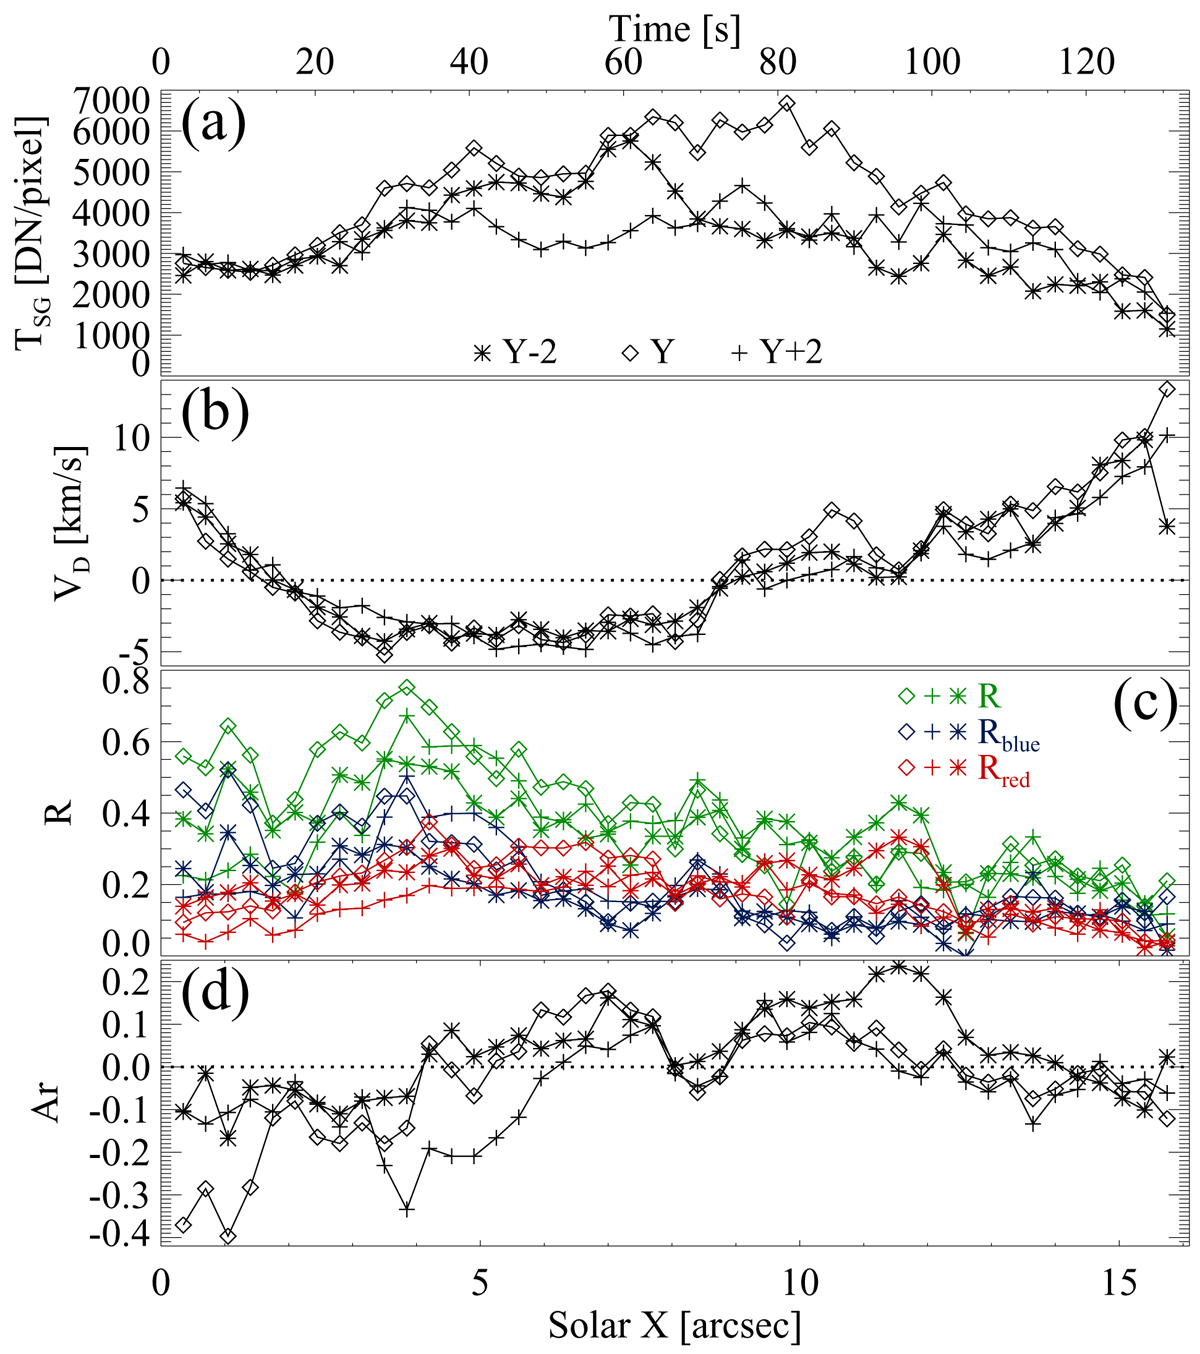
Same as Fig. 6, but for the positions two spatial pixels below (south of) and above (north of) the pixels where the line profile parameters in Fig. 6 are taken. This essentially follows the southern and northern edges of the loop. The variation along the southern edge of the loop is denoted by asterisks, and the variation along the northern edge by crosses. The diamonds show the variation along the central loop axis (cf. dotted line in Fig. 1b) and are identical to the data shown in Fig. 6.
Current usage metrics show cumulative count of Article Views (full-text article views including HTML views, PDF and ePub downloads, according to the available data) and Abstracts Views on Vision4Press platform.
Data correspond to usage on the plateform after 2015. The current usage metrics is available 48-96 hours after online publication and is updated daily on week days.
Initial download of the metrics may take a while.