Fig. 1.
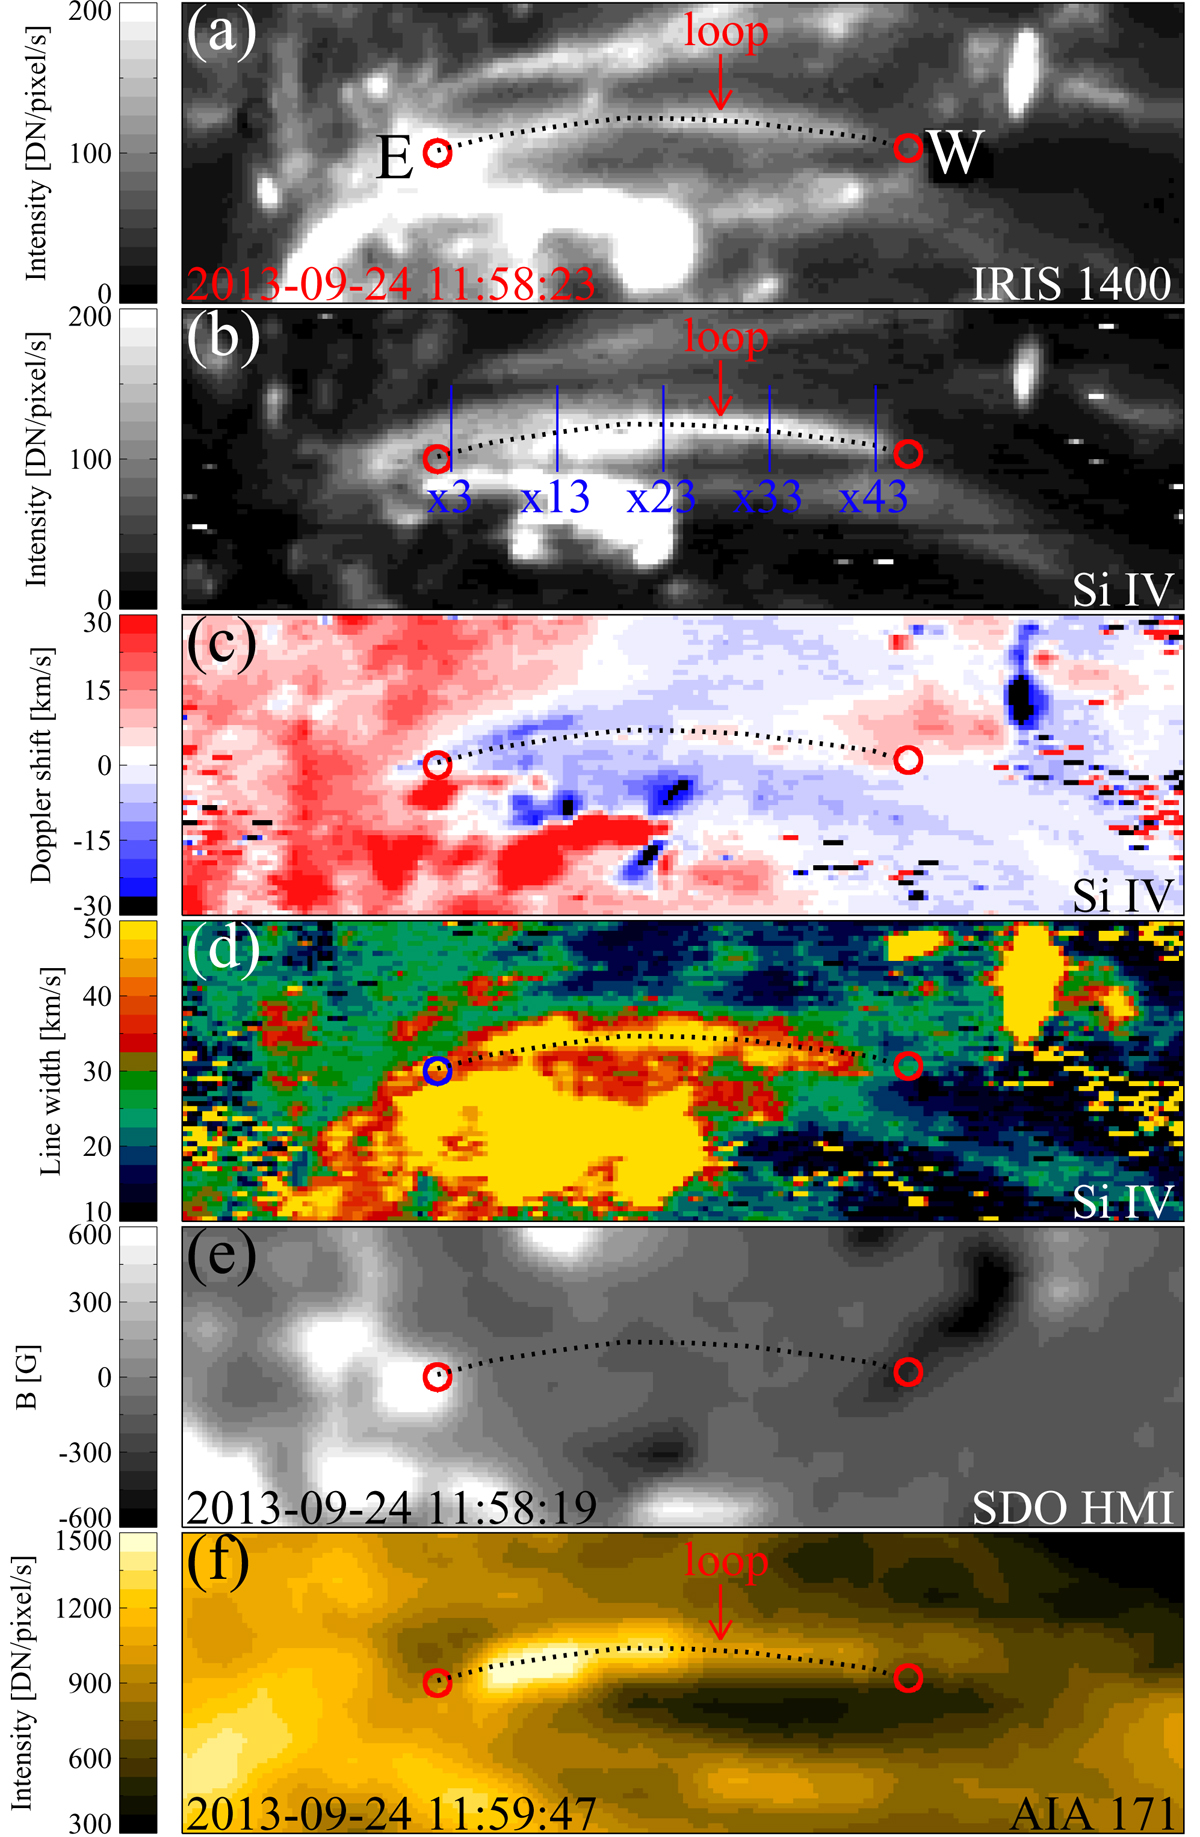
Cool loop and context from the IRIS and SDO data. Panel a: snapshot of the IRIS slit-jaw images in the 1400 Å channel. Panels b–d: intensity (b), Doppler shift (c), and 1/e line width (d) maps of the Si IV (1394 Å) line. Panel e: HMI line-of-sight magnetogram. Panel f: snapshot from the AIA images at 171 Å. The dotted lines indicate the Si IV loop. The circles mark two footpoints of the loop, where E and W indicate the eastern and western feet. The blue vertical lines x3, x13, x23, x33, and x43 in (b) indicate five samples of the spatial positions of the spectra shown in Fig. 3. The field of view is 33.2″ × 10.0″ with the center at solar (X, Y) = (−251.9″, 56.4″). See Sects. 2 and 3.1.
Current usage metrics show cumulative count of Article Views (full-text article views including HTML views, PDF and ePub downloads, according to the available data) and Abstracts Views on Vision4Press platform.
Data correspond to usage on the plateform after 2015. The current usage metrics is available 48-96 hours after online publication and is updated daily on week days.
Initial download of the metrics may take a while.