Fig. 6.
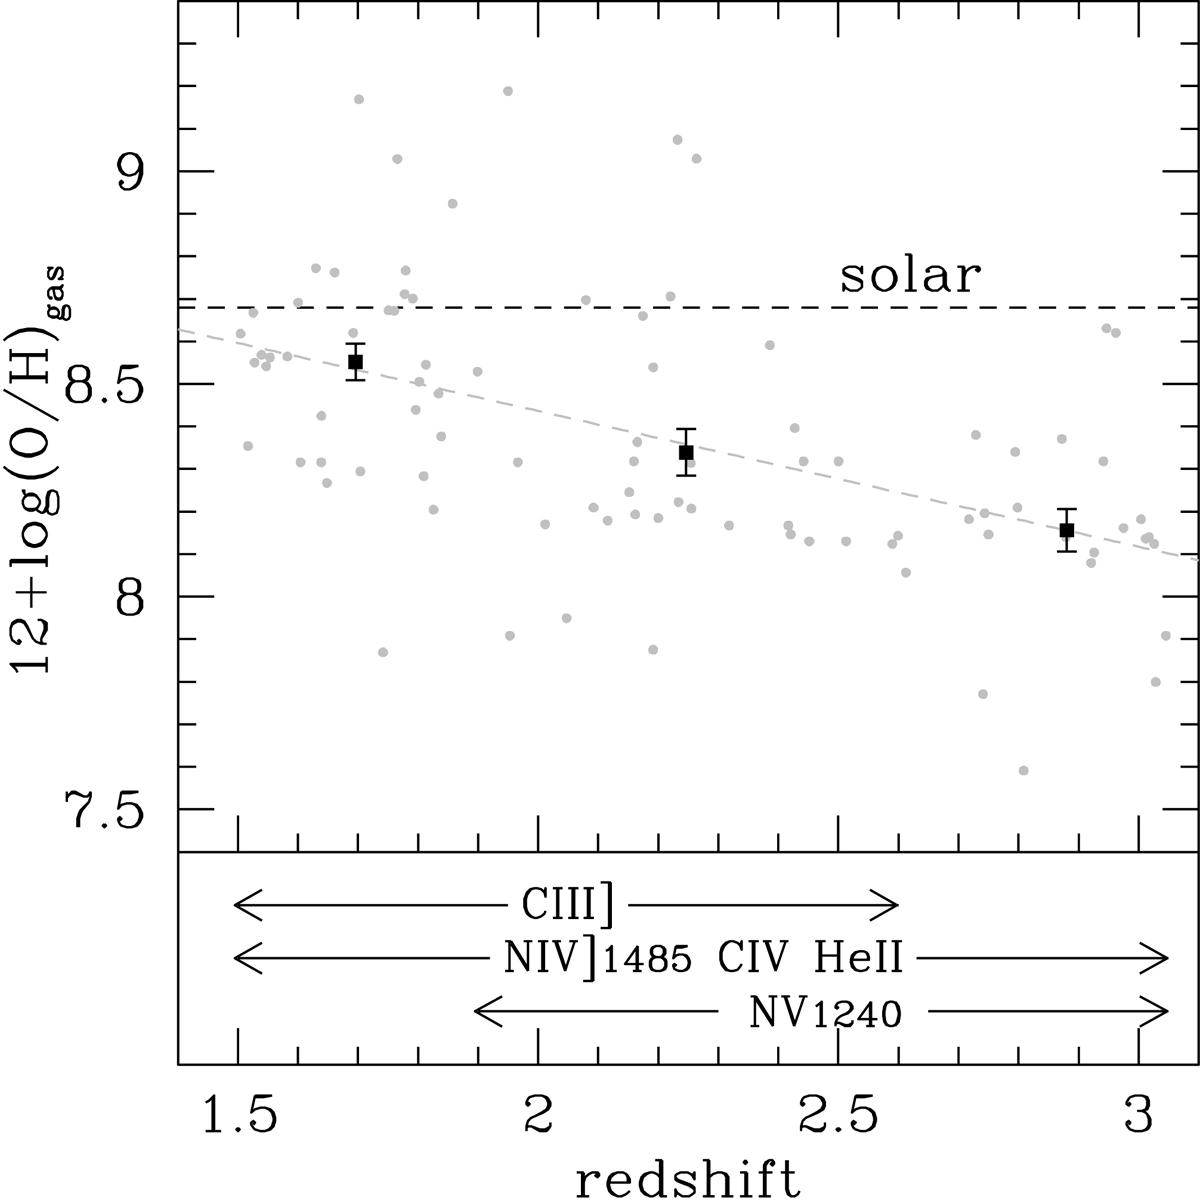
Evolution of the NLR gas-phase metallicity with redshift. The gray dots represent the individual C IV-selected type 2 AGN, while the black squares are the average oxygen abundance in three redshift bins. Lower panel: the arrows highlight the redshift intervals where the quoted emission lines are visible in the observed spectral range.
Current usage metrics show cumulative count of Article Views (full-text article views including HTML views, PDF and ePub downloads, according to the available data) and Abstracts Views on Vision4Press platform.
Data correspond to usage on the plateform after 2015. The current usage metrics is available 48-96 hours after online publication and is updated daily on week days.
Initial download of the metrics may take a while.