Fig. 5.
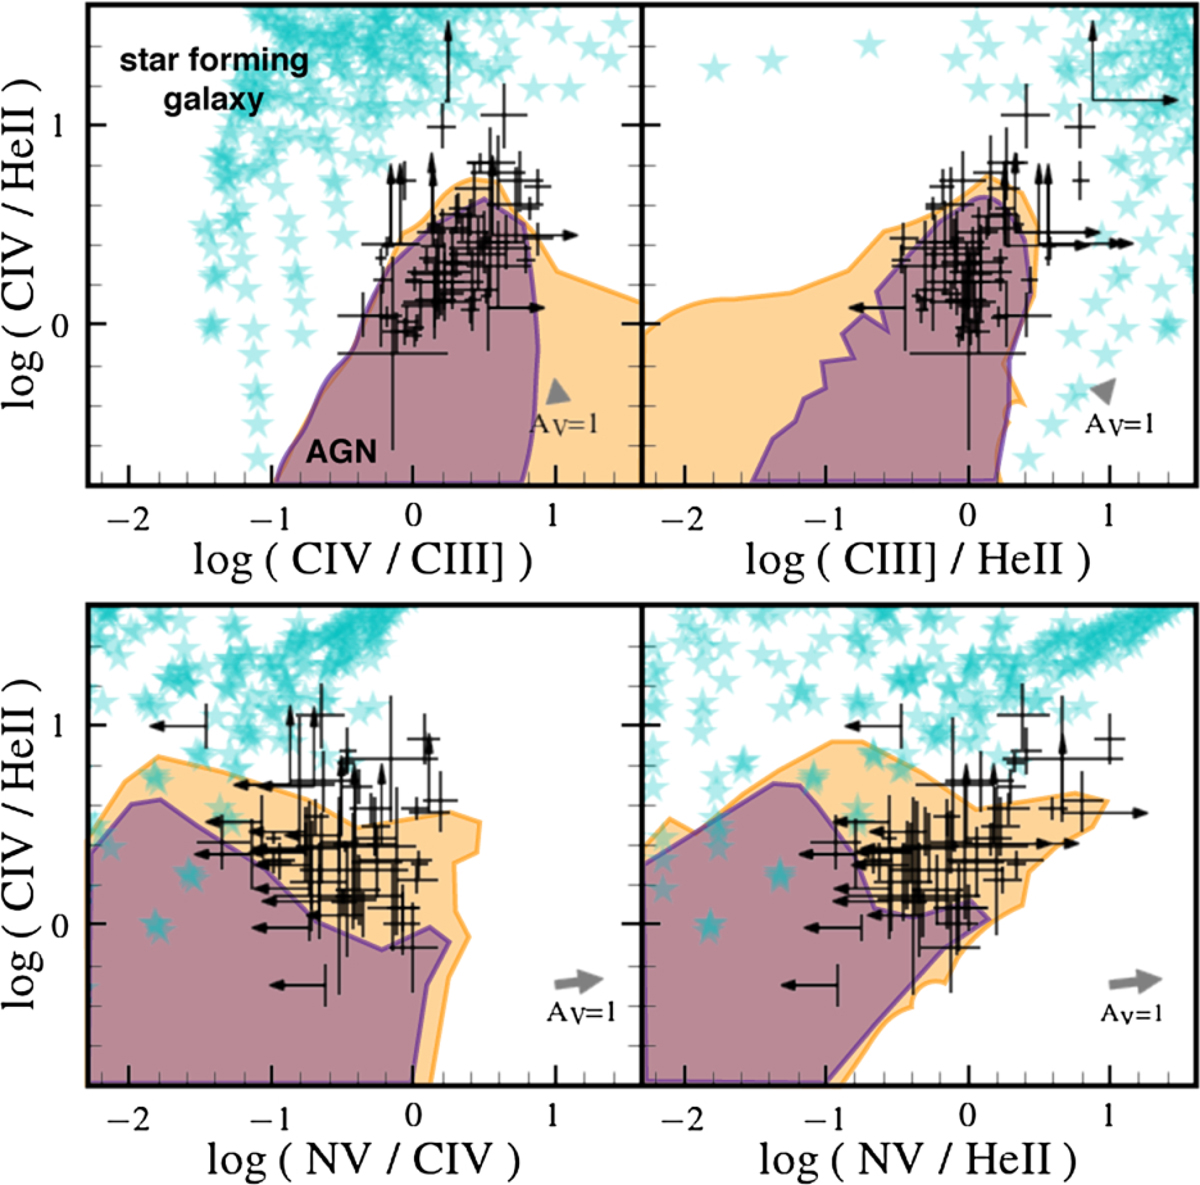
Predictions of the AGN NLR models described in Sect. 4.1 in the C IV/He II vs. C IV/C III] (top left), C III]/He II (top right), N V/C IV (bottom left) and N V/He II (bottom right) diagrams. Each panel shows data measurements with error bars and upper limits (black symbols) of the C IV-selected type 2 AGN, described in Sect. 3, and AGN models (shaded areas) encompassing wide ranges in power-law index, α, ionization parameter, ⟨U⟩, gas metallicity, Z, gas density, nH, and dust-to-metal mass ratio, ξd. The purple and orange shaded areas indicate AGN models with no microturbulence velocity and an inner radius of 300 pc and models with microturbulence velocity vmicr = 100 km s−1 and an inner radius of 90 pc, respectively. Cyan stars show the predictions from photoionization models of star-forming galaxies of Gutkin et al. (2016). In each panel, the gray arrows indicate the effect of correcting the AGN data by dust attenuation for a galactic attenuation curve (Cardelli et al. 1989) and AV = 1 mag.
Current usage metrics show cumulative count of Article Views (full-text article views including HTML views, PDF and ePub downloads, according to the available data) and Abstracts Views on Vision4Press platform.
Data correspond to usage on the plateform after 2015. The current usage metrics is available 48-96 hours after online publication and is updated daily on week days.
Initial download of the metrics may take a while.