Fig. 1.
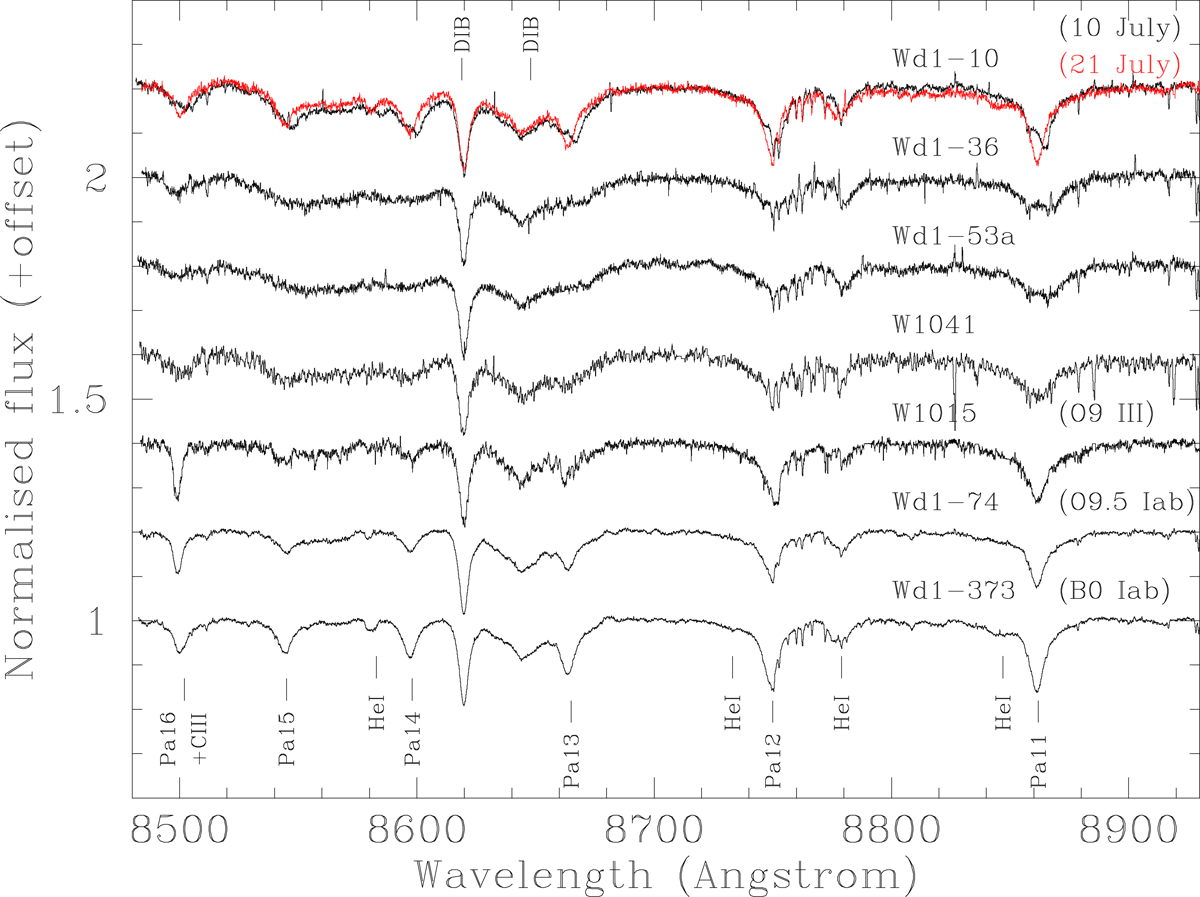
Montage of classification spectra (Wd1-74, -373 and W1015) and apparent SB2 binaries. Note the shallower, flat-bottomed photospheric profiles for Wd1-36, 53a and W1041 in comparison to the templates, indicative of unresolved SB2 systems. Two spectra are presented for Wd1-10 to demonstrate the pronounced line profile variability in the Paschen-11 and -12 photospheric lines, which transition from doubled- to single-troughed in the 11 days between the observations.
Current usage metrics show cumulative count of Article Views (full-text article views including HTML views, PDF and ePub downloads, according to the available data) and Abstracts Views on Vision4Press platform.
Data correspond to usage on the plateform after 2015. The current usage metrics is available 48-96 hours after online publication and is updated daily on week days.
Initial download of the metrics may take a while.