Fig. 3
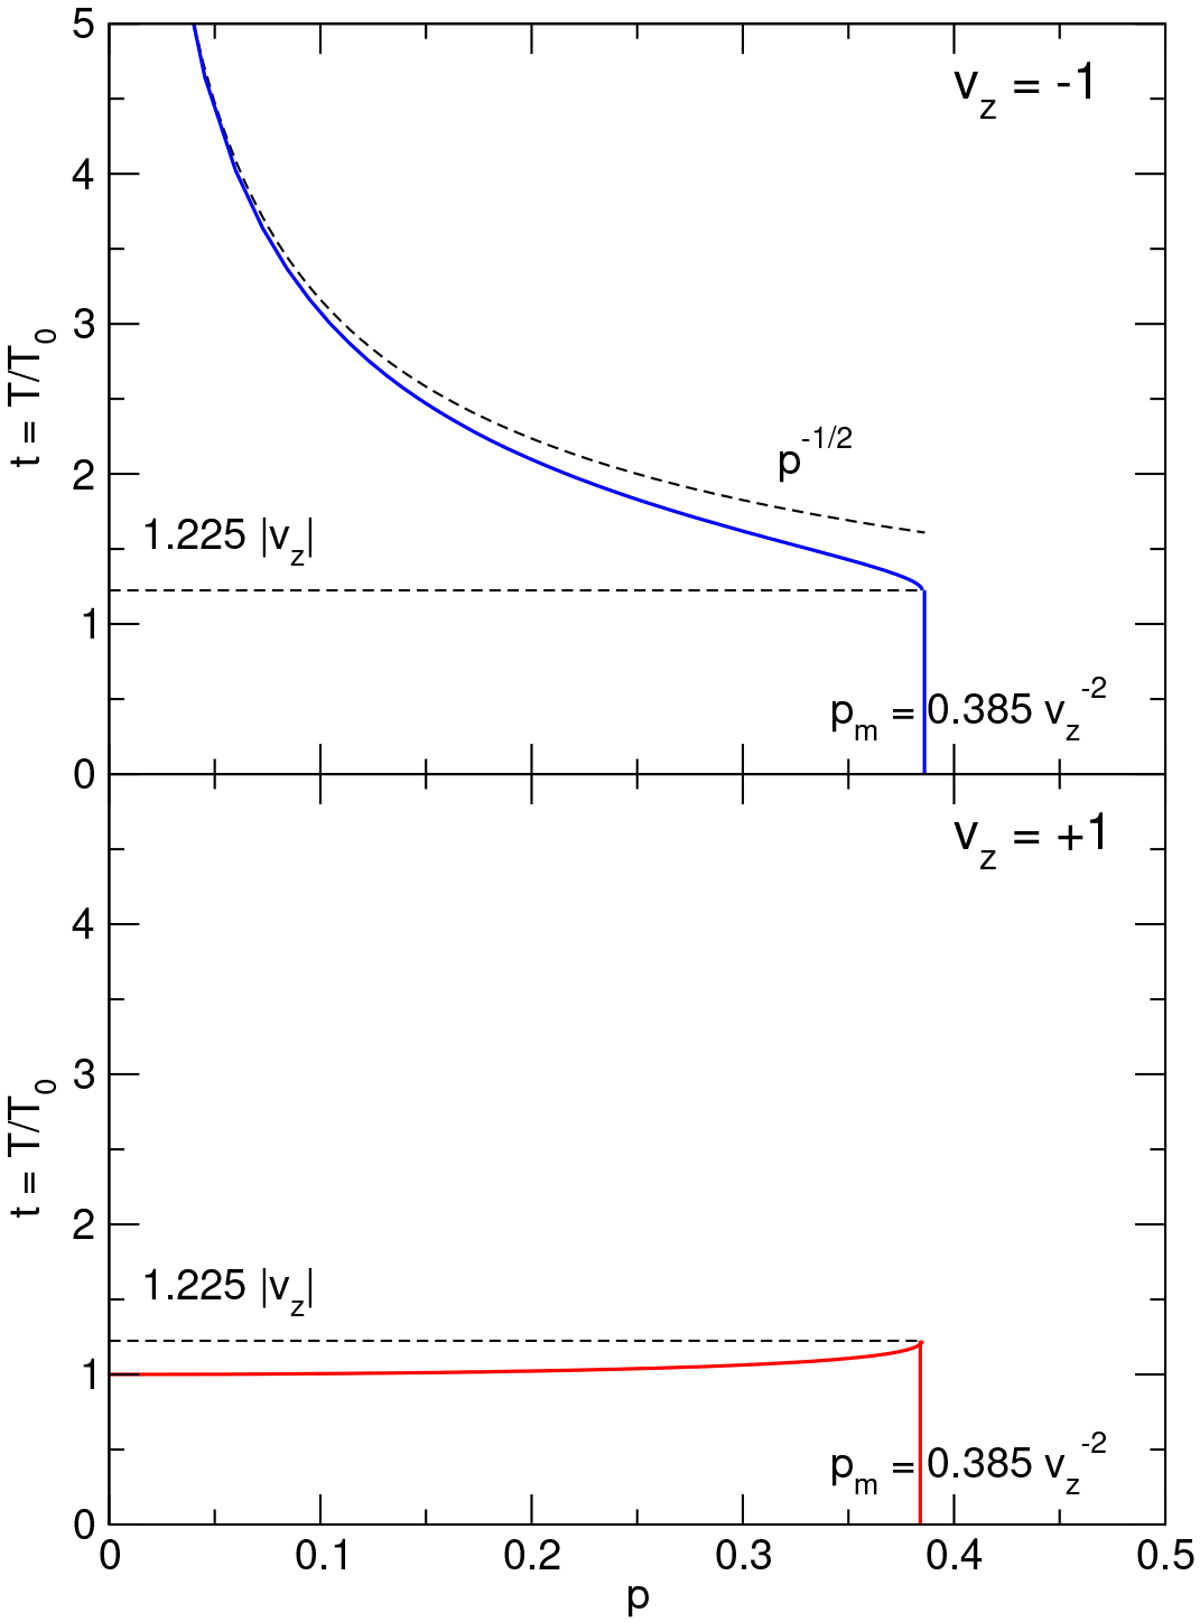
Intensity profiles t(p) for vz = −1 (top panel, blue) and vz = +1 (bottom panel, red). The different dashed lines indicate the blue and red wing temperature at the maximum value of p, p = pm, and the blue wing asymptotic behavior for p ≪ 1.
Current usage metrics show cumulative count of Article Views (full-text article views including HTML views, PDF and ePub downloads, according to the available data) and Abstracts Views on Vision4Press platform.
Data correspond to usage on the plateform after 2015. The current usage metrics is available 48-96 hours after online publication and is updated daily on week days.
Initial download of the metrics may take a while.