Fig. 21
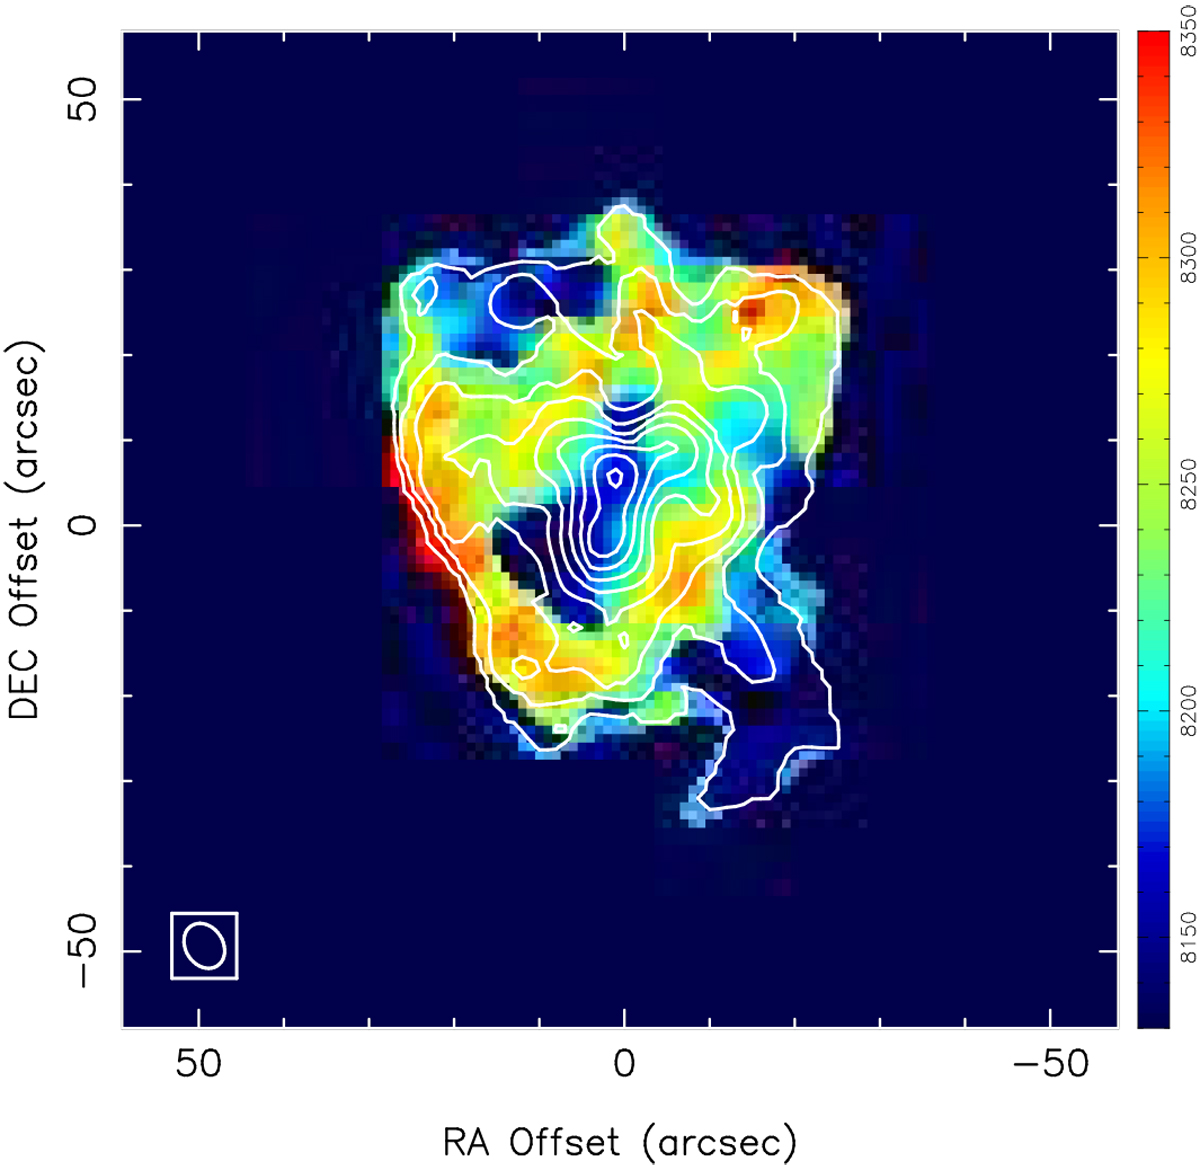
B335 zeroth-order (contours) and first-order moment (color scale) of the H13 CO+ (J = 1–0) line, obtained from the channel maps of Kurono et al. (2013). Contours are in steps of 511 mJy beam−1 km s−1. The color scale at the right border is in m s−1. The (0, 0) position corresponds to α(J2000) = 19h37m00.s89, δ(J2000) = +07°34′09.′′6. The synthesized beam is shown in the lower left corner.
Current usage metrics show cumulative count of Article Views (full-text article views including HTML views, PDF and ePub downloads, according to the available data) and Abstracts Views on Vision4Press platform.
Data correspond to usage on the plateform after 2015. The current usage metrics is available 48-96 hours after online publication and is updated daily on week days.
Initial download of the metrics may take a while.