Fig. 2
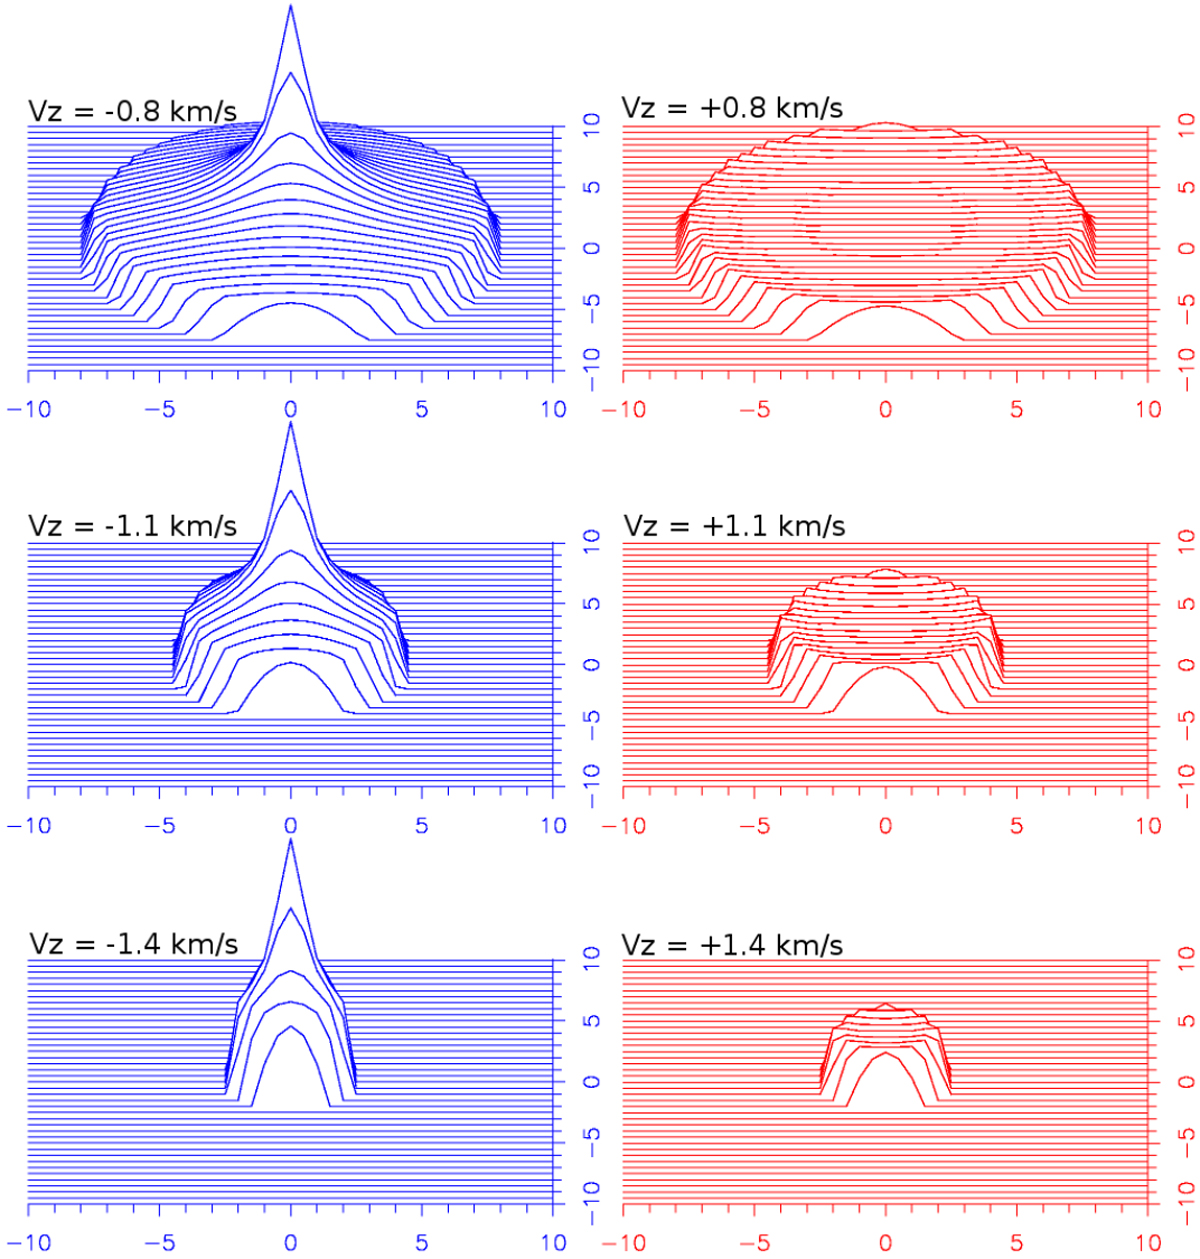
Intensity maps for pairs of LOS-velocities, Vz = ±0.8 km s−1 (top), ± 1.1 km s−1 (middle), and ± 1.4 km s−1 (bottom), calculated for a a mass M* = 1 M⊙, a distance of 140 pc, and a beam of 0.′′1. The axes are position offsets labeled in arcsec. The intensity scale is the same for all maps. We note the sharp peak at the center of the blueshifted LOS-velocity maps (left), and the flat, slightly concave shape of the redshifted LOS-velocity maps (right), and the more compact emission for high values |Vz | (bottom) than for low values of |Vz| (top).
Current usage metrics show cumulative count of Article Views (full-text article views including HTML views, PDF and ePub downloads, according to the available data) and Abstracts Views on Vision4Press platform.
Data correspond to usage on the plateform after 2015. The current usage metrics is available 48-96 hours after online publication and is updated daily on week days.
Initial download of the metrics may take a while.