Fig. 19
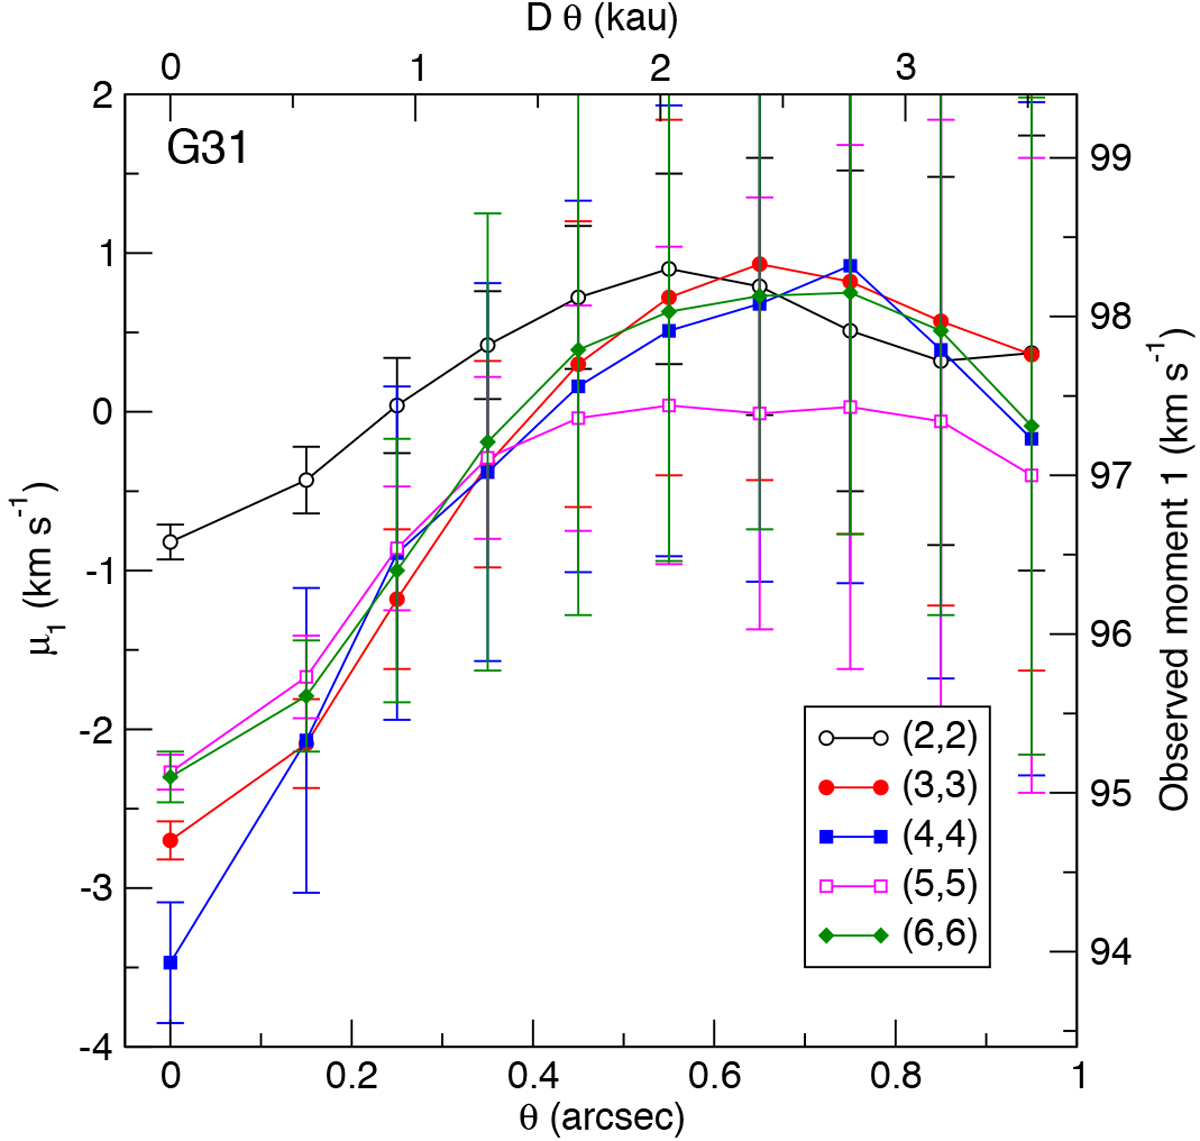
G31 first-order moment for the ammonia inversion transitions (2, 2) (black line and open circles), (3, 3) (red line andfilled circles), (4, 4) (blue line and filled squares), (5, 5) (magenta line and open squares), and (6, 6) (green line and filled diamonds) (Mayen-Gijon et al. 2014), as a function of angular distance, measured for rings of width 0.′′ 1 and average radius θ. The error bars are the rms of the velocity inside each ring. The right-hand vertical axis shows the velocities obtained from the first-order moment maps, while the left-hand vertical axis shows the velocity with respect to the systemic velocity of G31, taken as V sys = 97.4 km s−1.
Current usage metrics show cumulative count of Article Views (full-text article views including HTML views, PDF and ePub downloads, according to the available data) and Abstracts Views on Vision4Press platform.
Data correspond to usage on the plateform after 2015. The current usage metrics is available 48-96 hours after online publication and is updated daily on week days.
Initial download of the metrics may take a while.