Fig. 18
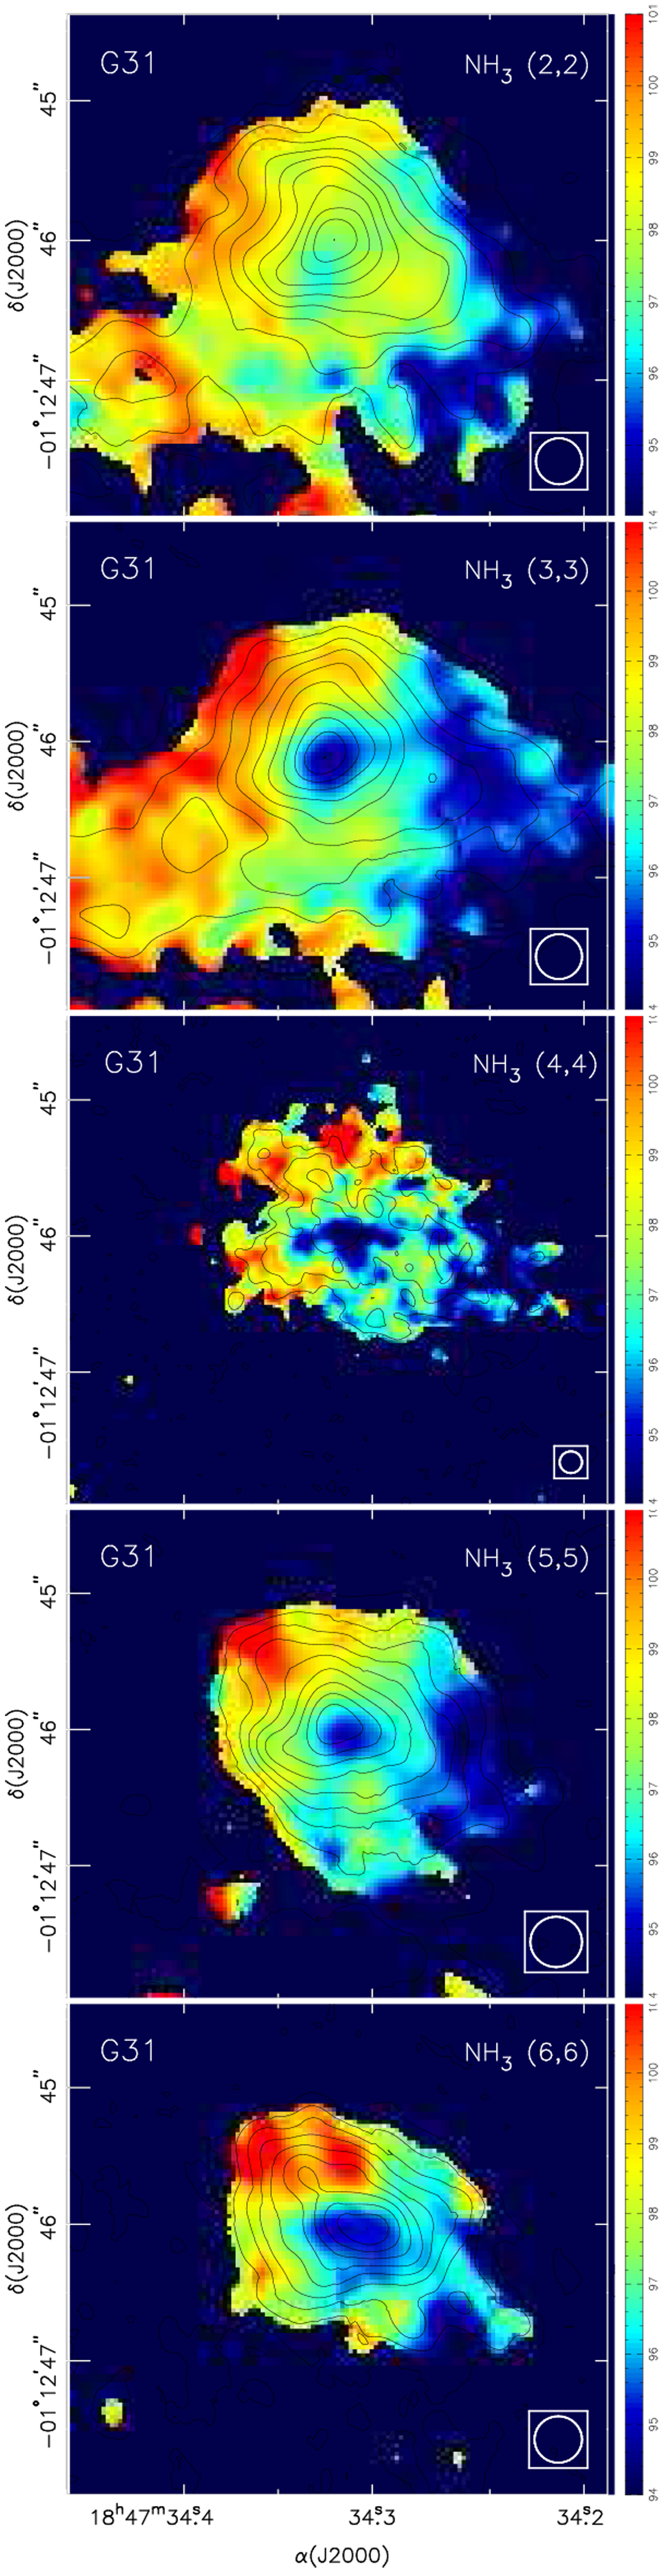
Maps of G31 first-order (color scale) and zeroth-order moment (contours) for the ammonia inversion transitions (2, 2) to (6, 6) (Mayen-Gijon et al. 2014). The color scale, the same for all panels, ranges from 94 to 101 km s−1. The contours are in steps of 10% of the peak value for all the maps, except for the (4, 4) transition, for which the steps are 20%. The beam is shown in the lower right corner of each panel.
Current usage metrics show cumulative count of Article Views (full-text article views including HTML views, PDF and ePub downloads, according to the available data) and Abstracts Views on Vision4Press platform.
Data correspond to usage on the plateform after 2015. The current usage metrics is available 48-96 hours after online publication and is updated daily on week days.
Initial download of the metrics may take a while.