Fig. 6
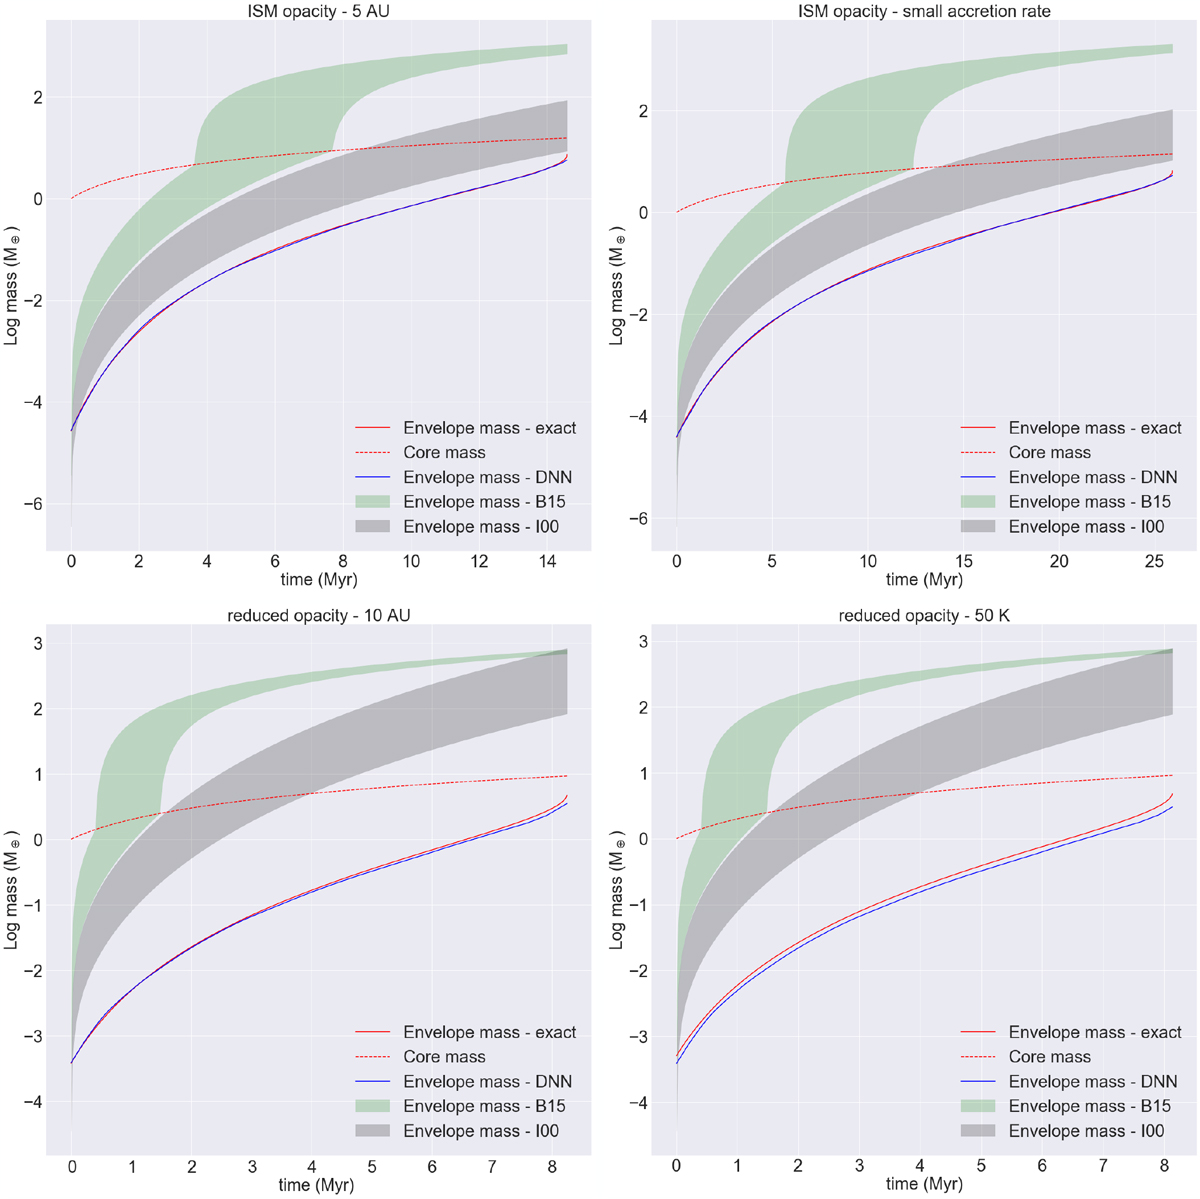
Evolution of the envelope mass as computed with the solved equations of the internal structure (red lines) and with our DNN (blue lines). We also show the comparison with what would be obtained using the approach of I00 (grey areas), and B15 (green areas) for different choices of the envelope opacity (see text). The evolution of the core mass is shown by the red dashed line. Each figure has different scales for the time and the envelope mass. Upper left: with the BL94 opacity for a planet at 5 AU that accretes with Ṁcore = 10−6 M⊕ yr−1. Upper right: with the BL94 opacity for a planet at 5 AU that accretes with Ṁcore = 5 × 10⁻⁷ M⊕ yr−1. Lower left: with a reduced opacity for a planet at 10 AU that accretes with Ṁcore = 10−6 M⊕ yr−1. Lower right: with a reduced opacity for a planet at 5 AU that accrete with Ṁcore = 10−6 M⊕ yr−1, but assuming a disc temperature equal to 50 K (150 K in all other cases). The kink in the green areas is due to the rapid runaway accretion of gas when the planet reaches the cross-over mass (mass of accreted gas equal to the mass of accreted solids; see B15).
Current usage metrics show cumulative count of Article Views (full-text article views including HTML views, PDF and ePub downloads, according to the available data) and Abstracts Views on Vision4Press platform.
Data correspond to usage on the plateform after 2015. The current usage metrics is available 48-96 hours after online publication and is updated daily on week days.
Initial download of the metrics may take a while.