Fig. A.1.
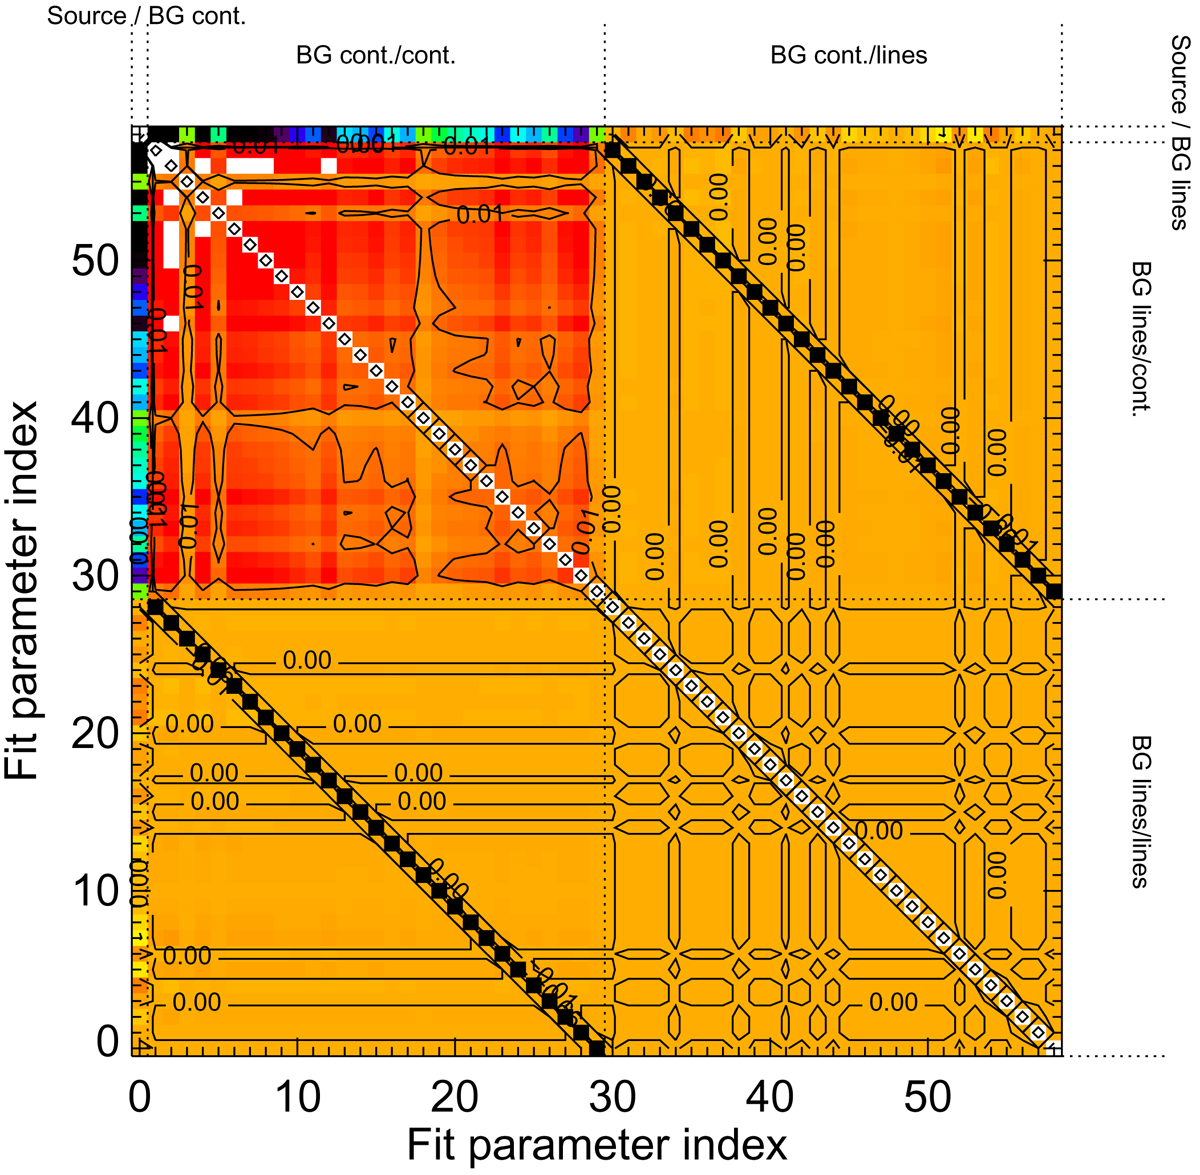
Correlation matrix of the three-component maximum-likelihood fit with SPI in the energy bin 1795.0–1795.5 keV. The background component continuum and lines have been re-scaled 29 times each, corresponding to the time between two annealing periods (or detector failure and annealing period). The individual blocks are further explained in Figs. A.2a–A.2c.
Current usage metrics show cumulative count of Article Views (full-text article views including HTML views, PDF and ePub downloads, according to the available data) and Abstracts Views on Vision4Press platform.
Data correspond to usage on the plateform after 2015. The current usage metrics is available 48-96 hours after online publication and is updated daily on week days.
Initial download of the metrics may take a while.