Fig. 6.
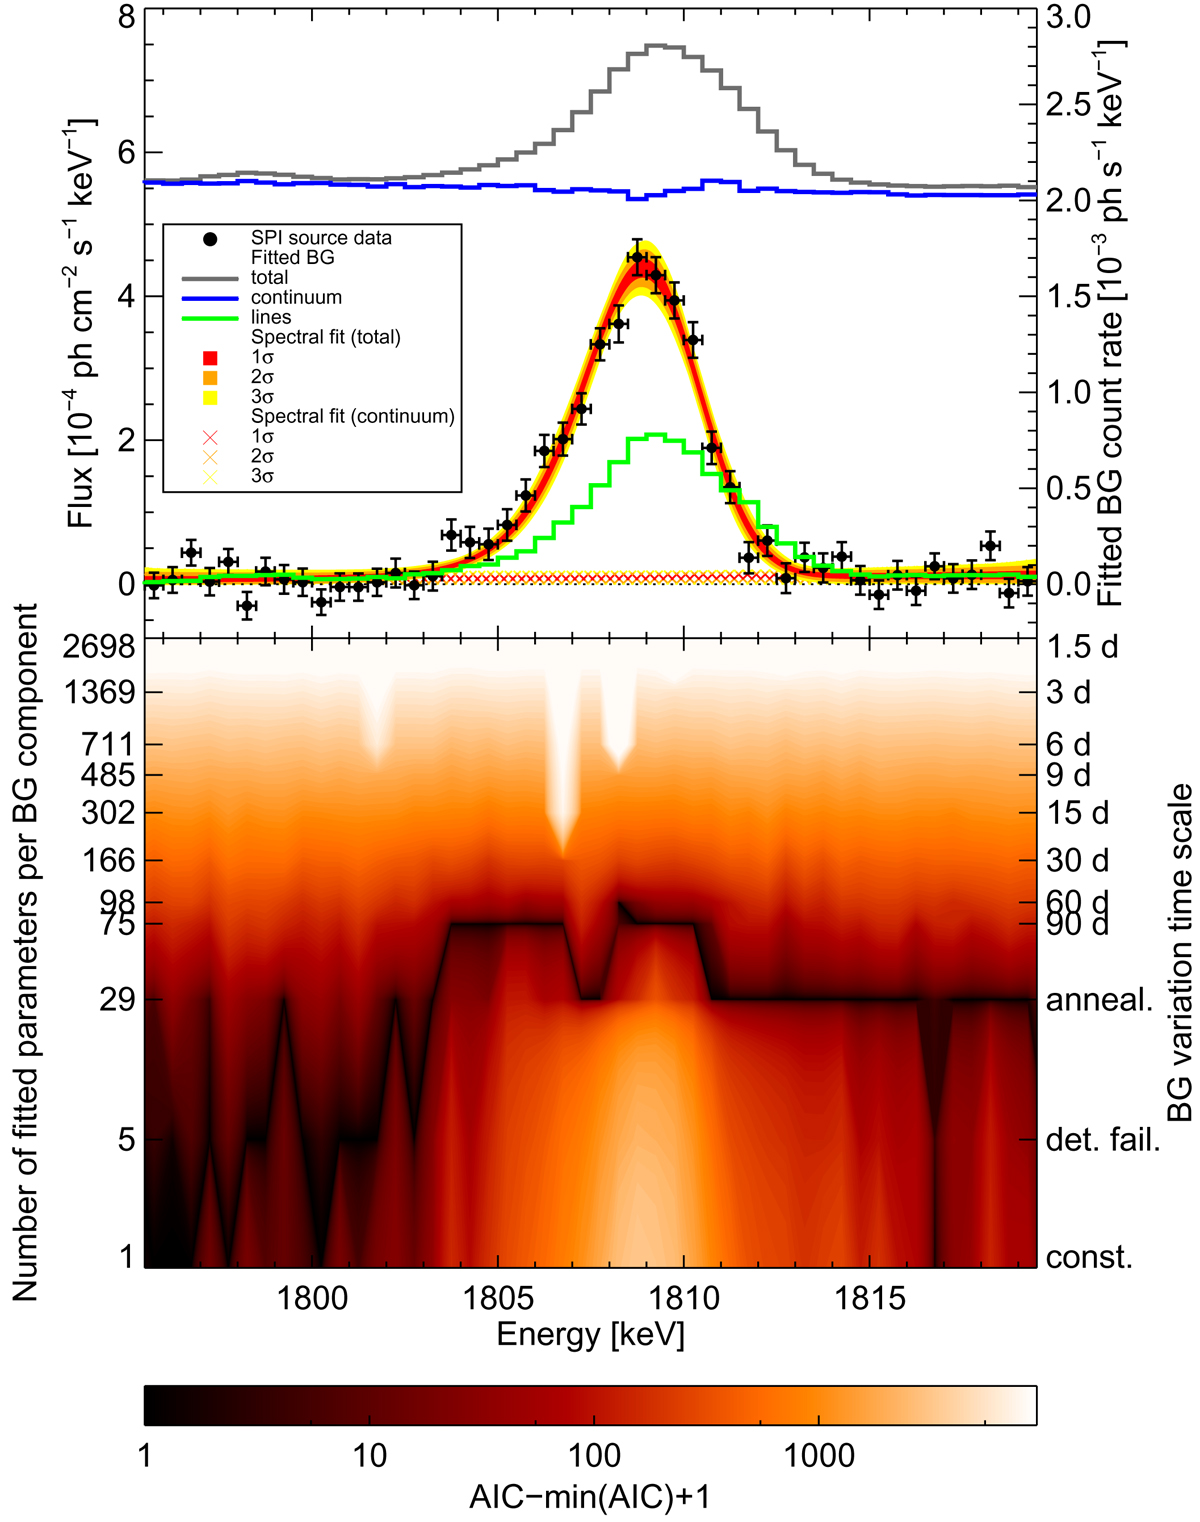
Study of background scaling in the 26Al region. Bottom panel: AIC, similar to Fig. 5a, but as a function of energy. From the optimal AIC at each energy bin, the flux is determined (black data points, upper panel, left axis). In addition, we show the fitted background (grey), divided into continuum (blue) and line (green) contributions (upper panel, right axis). To the black data points, a degraded Gaussian line on top of a power-law continuum is fitted, and shown as 1, 2, and 3σ uncertainty bands. The dotted line marks the zero flux level.
Current usage metrics show cumulative count of Article Views (full-text article views including HTML views, PDF and ePub downloads, according to the available data) and Abstracts Views on Vision4Press platform.
Data correspond to usage on the plateform after 2015. The current usage metrics is available 48-96 hours after online publication and is updated daily on week days.
Initial download of the metrics may take a while.