Fig. 5.
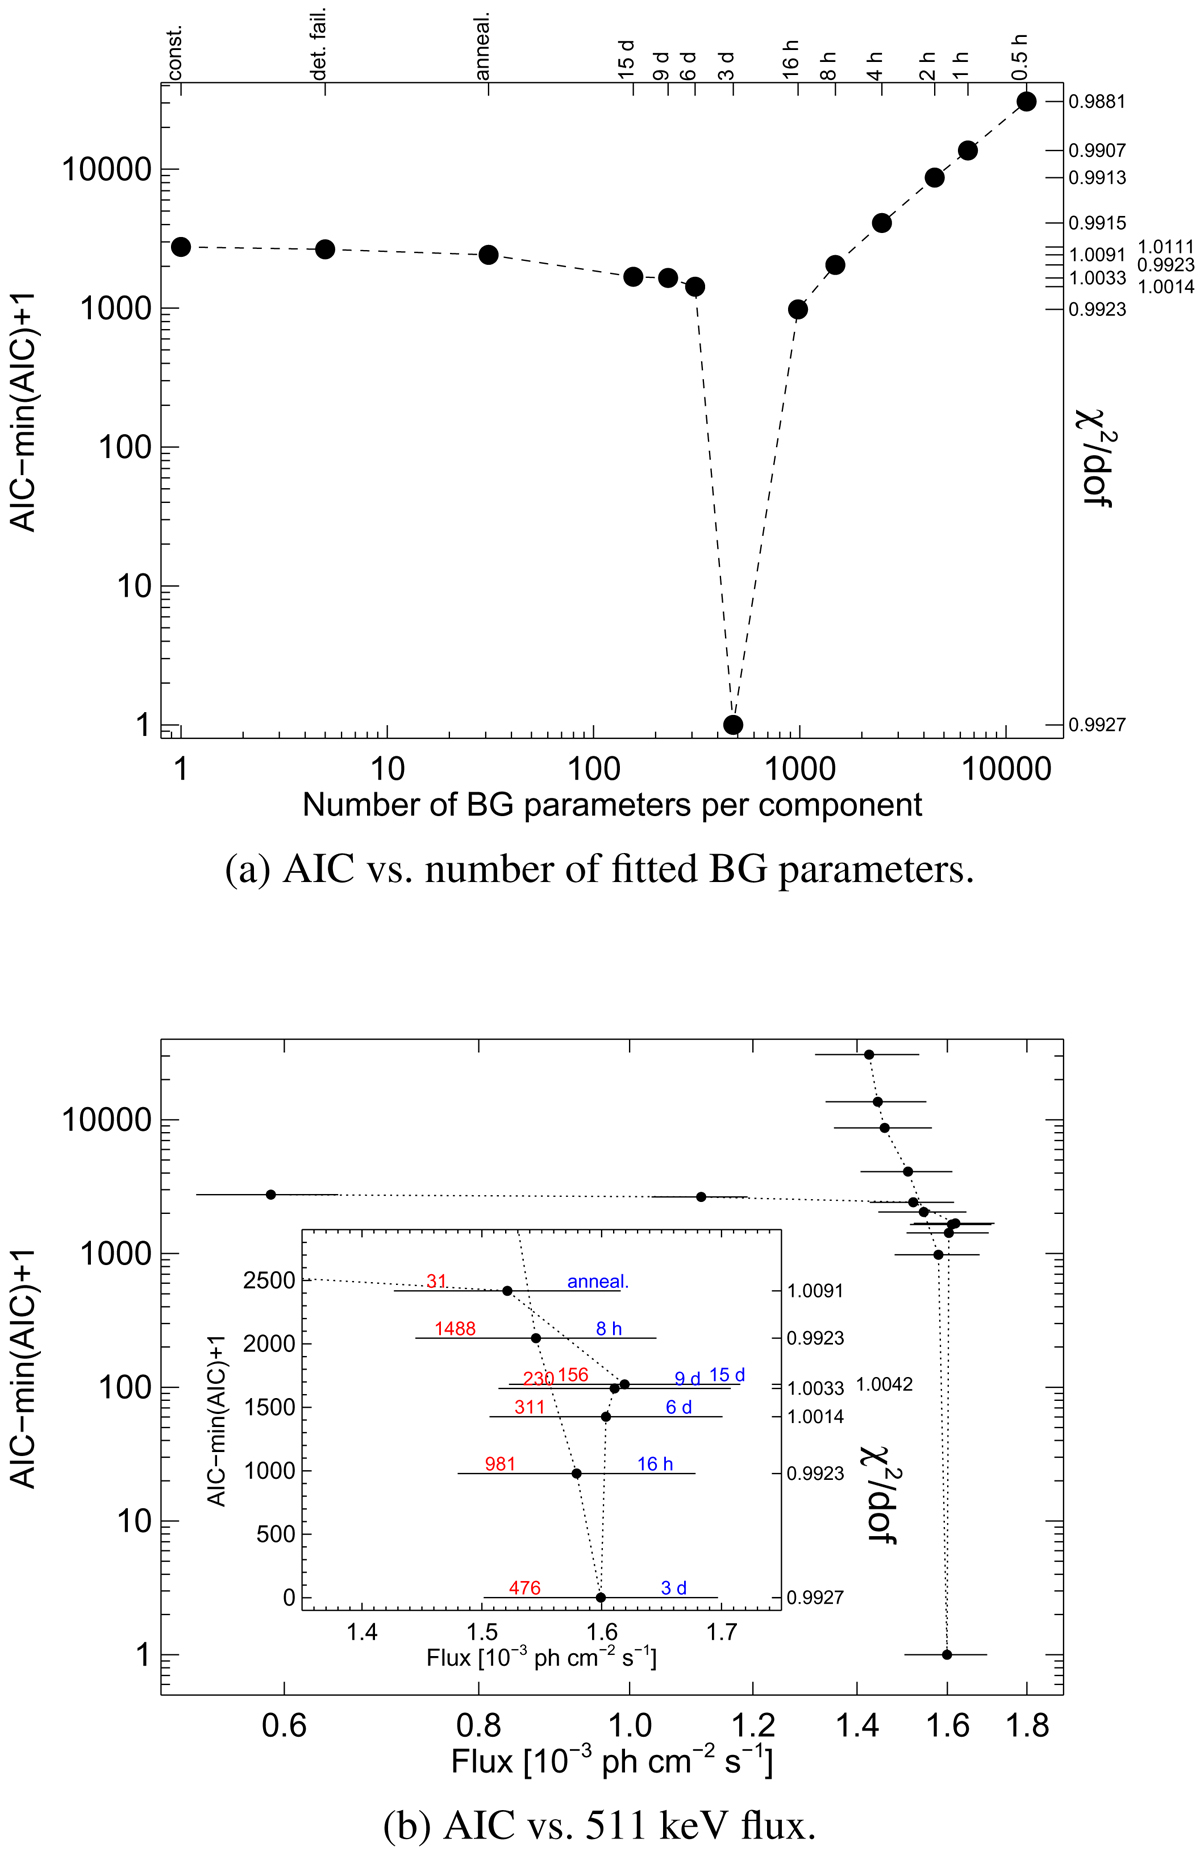
Variation in the AIC in fits of the 511 keV emission band against the number of fitted background parameters per component (top). Bottom panel: variations with the measured flux values for each fit, indicating the timescales in blue, and the corresponding number of fitted parameters in red. The corresponding reduced χ2 values are indicated on the right axis.
Current usage metrics show cumulative count of Article Views (full-text article views including HTML views, PDF and ePub downloads, according to the available data) and Abstracts Views on Vision4Press platform.
Data correspond to usage on the plateform after 2015. The current usage metrics is available 48-96 hours after online publication and is updated daily on week days.
Initial download of the metrics may take a while.