Fig. 9.
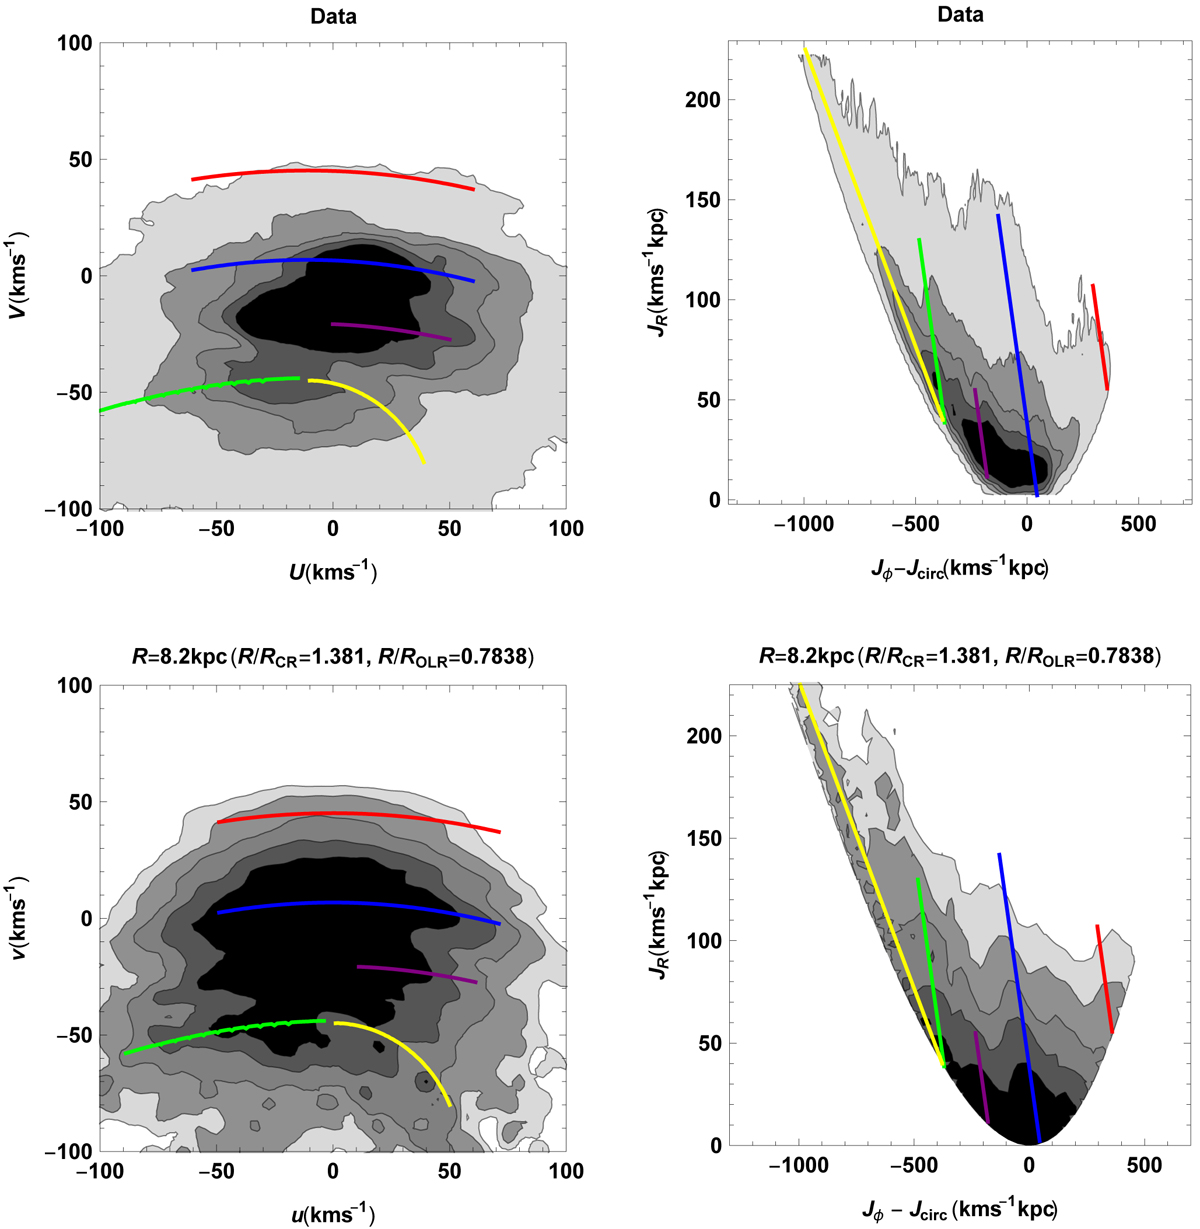
Top row, left panel: Gaia (U, V) kinematics in the solar neighbourhood from Fig. 8; the contours contain 50, 68, 80, 90, and 99% of the stars. Top row, right panel: as in the left panel, but here the stars are plotted in the space of actions (Jϕ − Jcirc, JR); the actions are computed assuming the P17 background potential, the epicyclic approximation, and (U⊙, V⊙) = (11.1, 0) km s−1; Jcirc is the angular momentum of a circular orbit at the Sun. Bottom row, left panel: (u, v) distribution at the Sun obtained via backward integration from Fig. 8; the contours contain 50, 68, 80, 90, and 95% of the stars. Bottom row, right panel: as in the left panel, but here the stars are plotted in the space of actions (Jϕ − Jcirc, JR). In all the plots the coloured lines represent the same and corresponding positions in the (u, v), (Jϕ − Jcirc, JR), and (U, V) spaces. Shown is the effect of the CR (Hercules, green line), 6:1 (horn, purple line), and 4:1 (blue line) on both the model and data. The 2:1 resonance (red line) is also present in both, and most prominently seen in action space, but with a slight position mismatch between model and data, linked to the choice of V⊙ and the shape of the circular velocity curve of the axisymmetric background (see text). Also shown is the prominent deformation in the velocity plane of the data at (U, V) ∼ (−35, −15) km s−1, namely the Hyades moving group, which is not reproduced by our bar-only model, and which has long been suspected to be related to a spiral perturbation.
Current usage metrics show cumulative count of Article Views (full-text article views including HTML views, PDF and ePub downloads, according to the available data) and Abstracts Views on Vision4Press platform.
Data correspond to usage on the plateform after 2015. The current usage metrics is available 48-96 hours after online publication and is updated daily on week days.
Initial download of the metrics may take a while.