Fig. 5.
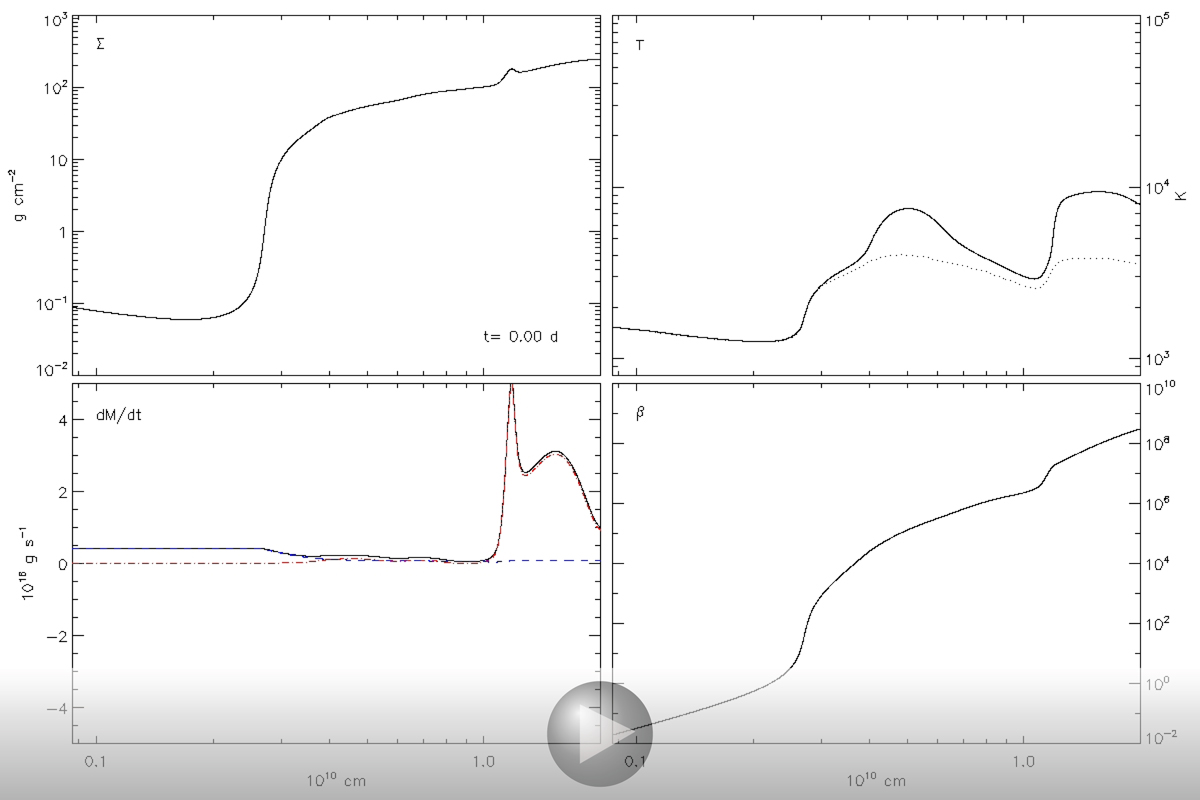
Time evolution of the radial structure of the unstable disk with μ30 = 1. Clockwise from top left: Σ; Tc and Teff (dotted line); β; Ṁ (solid line), Ṁrϕ (red dot dashed line), and Ṁzϕ (blue dashed line). The time t in the Σ panel corresponds to the time in the μ30 = 1 light curve shown in Fig. 4. Requires Adobe Reader (Movie). If the embedded movie does not display correctly, you can also access it online.
Current usage metrics show cumulative count of Article Views (full-text article views including HTML views, PDF and ePub downloads, according to the available data) and Abstracts Views on Vision4Press platform.
Data correspond to usage on the plateform after 2015. The current usage metrics is available 48-96 hours after online publication and is updated daily on week days.
Initial download of the metrics may take a while.