Fig. 3
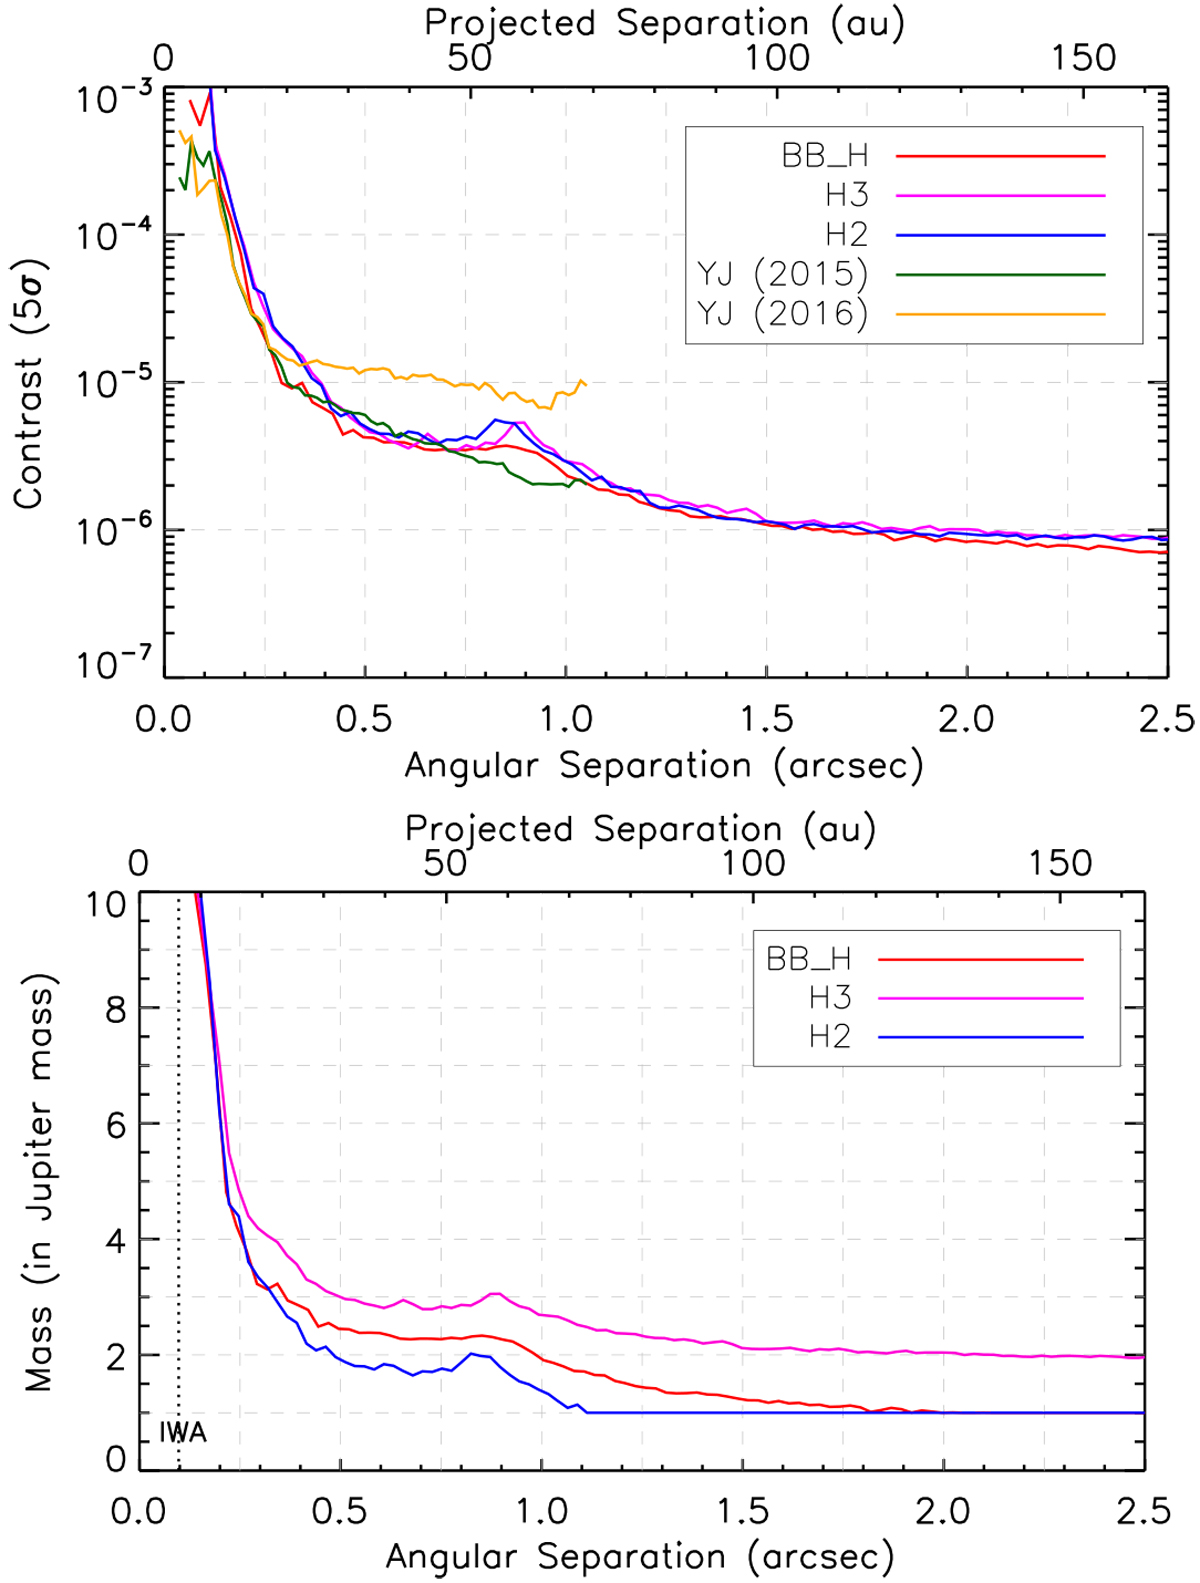
Top: contrast limits at 5σ for the IRDIS observation in BB_H (red), H3 (purple), H2 (blue) bands, and for the IFS observations in YJ bands (green for 2015 and yellow for 2016). These contrast limits are obtained with the TLOCI reduction. Bottom: detection limits in planet masses obtained with the BHAC-2015+COND evolutionary models (Baraffe et al. 2015) for an age of 23 ± 3 Myr, for the IRDIS BB_H (red), H2 (purple), and H3 (blue) bands. IWA correspond to the inner working angle of the coronagraph.
Current usage metrics show cumulative count of Article Views (full-text article views including HTML views, PDF and ePub downloads, according to the available data) and Abstracts Views on Vision4Press platform.
Data correspond to usage on the plateform after 2015. The current usage metrics is available 48-96 hours after online publication and is updated daily on week days.
Initial download of the metrics may take a while.