Open Access
Fig. 1
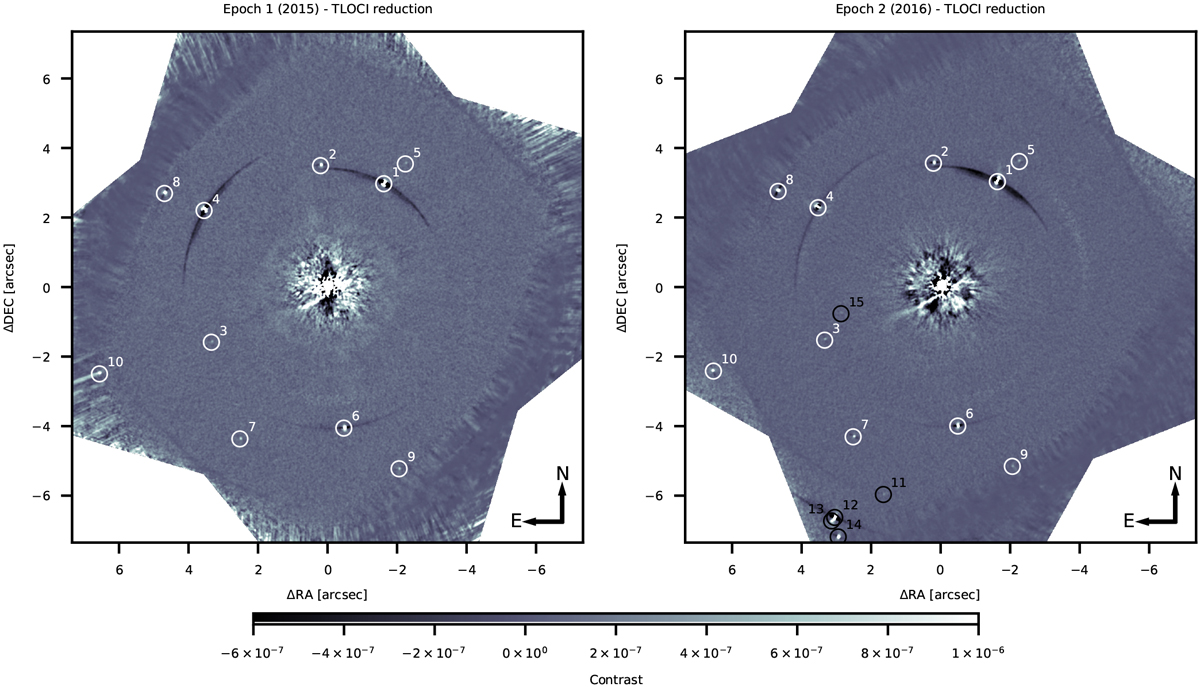
IRDIS images of the first and second epochs, reduced with the TLOCI algorithm. North is up and east is left. Point sources are indicated with circles and numeric labels. Whites circles are used for point sources detected at both epochs and black circles for point sources detected at the second epoch only.
Current usage metrics show cumulative count of Article Views (full-text article views including HTML views, PDF and ePub downloads, according to the available data) and Abstracts Views on Vision4Press platform.
Data correspond to usage on the plateform after 2015. The current usage metrics is available 48-96 hours after online publication and is updated daily on week days.
Initial download of the metrics may take a while.