Fig. B.1
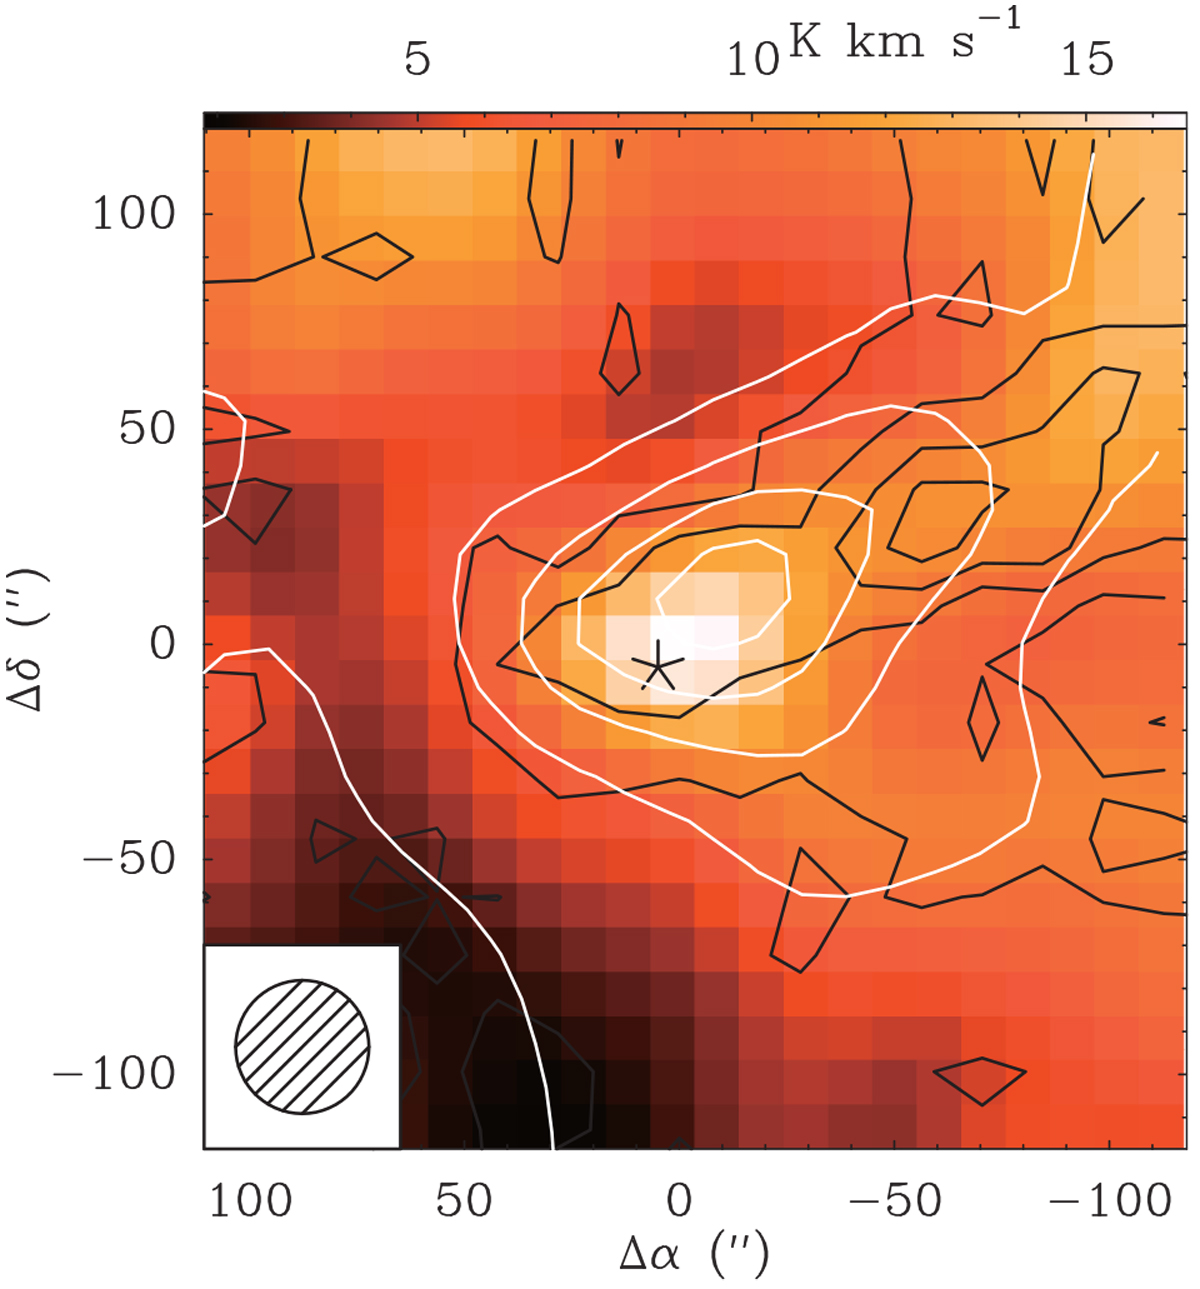
Color map of velocity integrated intensity of the [C I] 609 μm line overlaid with velocity integrated intensity map contours of C2H (in black) and CO J = 6 → 5 (in white). Her 36 is the central position (Δα = 0, Δδ = 0) at RA (J2000) = 18h03m40.3s and Dec (J2000) = –24°22′43′′, marked withan asterisk. For both C2H and CO J = 6 → 5, the contour levels are 10–100% in steps of 20% of the peak emission. All maps were convolved to the same resolution of 30″.
Current usage metrics show cumulative count of Article Views (full-text article views including HTML views, PDF and ePub downloads, according to the available data) and Abstracts Views on Vision4Press platform.
Data correspond to usage on the plateform after 2015. The current usage metrics is available 48-96 hours after online publication and is updated daily on week days.
Initial download of the metrics may take a while.