Fig. 7
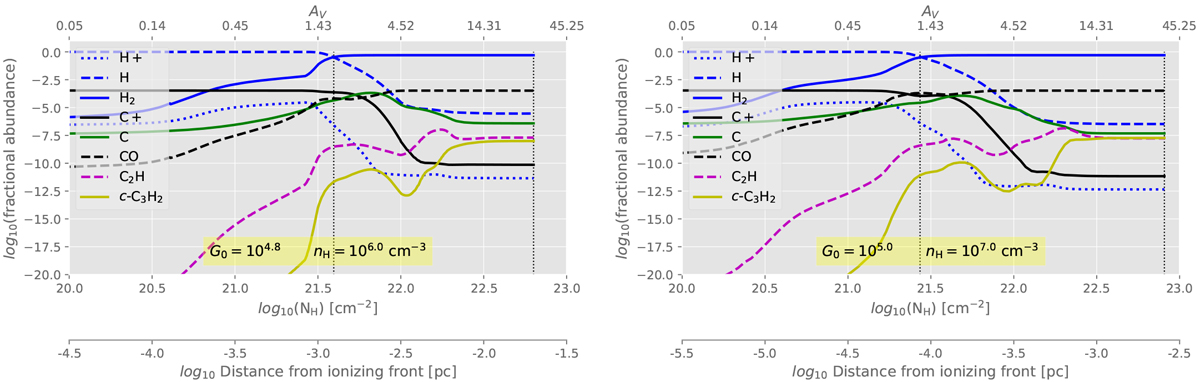
PDR models for M8 for G0 = 104.8 and nH = 105 cm−3 (left panel) and G0 = 105 and nH = 107 cm−3 (right panel). The fractional abundances (nX∕nH) are represented by the color codes/lines patterns indicated on the plots and measured by the ordinates. The top abscissa indicates the corresponding visual extinction (AV) as seen from the ionizing front (the impinging radiation field goes from left to right of the plot). The first bottom abscissa gives the corresponding total hydrogen column density N(H). A second bottom abscissa shows the actual distance (in parsec) from the ionizing front. The vertical dashed lines demarcate the region where most of the hydrogen gas is in molecular form.
Current usage metrics show cumulative count of Article Views (full-text article views including HTML views, PDF and ePub downloads, according to the available data) and Abstracts Views on Vision4Press platform.
Data correspond to usage on the plateform after 2015. The current usage metrics is available 48-96 hours after online publication and is updated daily on week days.
Initial download of the metrics may take a while.