Fig. 6
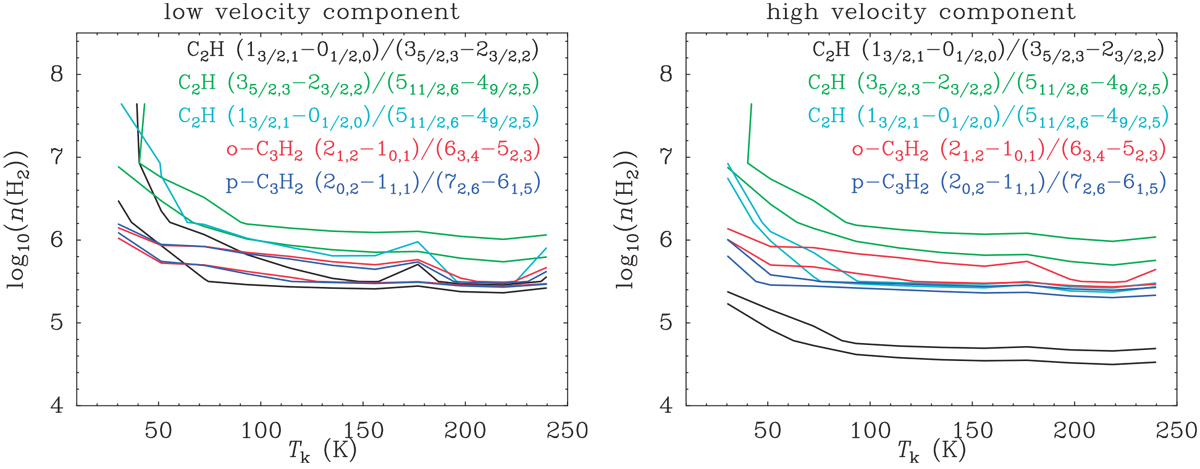
Results obtained from RADEX modeling for the main beam brightness temperature ratios of various transitions of C2 H and c-C3H2 toward Her 36 in a log10(n(H2)) versus Tk grid. Left and right panels: low velocity and high velocity components, respectively. The two contours per color represent the RADEX modeling output values equal to the upper and lower bounds of the value obtained for each ratio from the observationswith an error of 20%.
Current usage metrics show cumulative count of Article Views (full-text article views including HTML views, PDF and ePub downloads, according to the available data) and Abstracts Views on Vision4Press platform.
Data correspond to usage on the plateform after 2015. The current usage metrics is available 48-96 hours after online publication and is updated daily on week days.
Initial download of the metrics may take a while.