Fig. 5
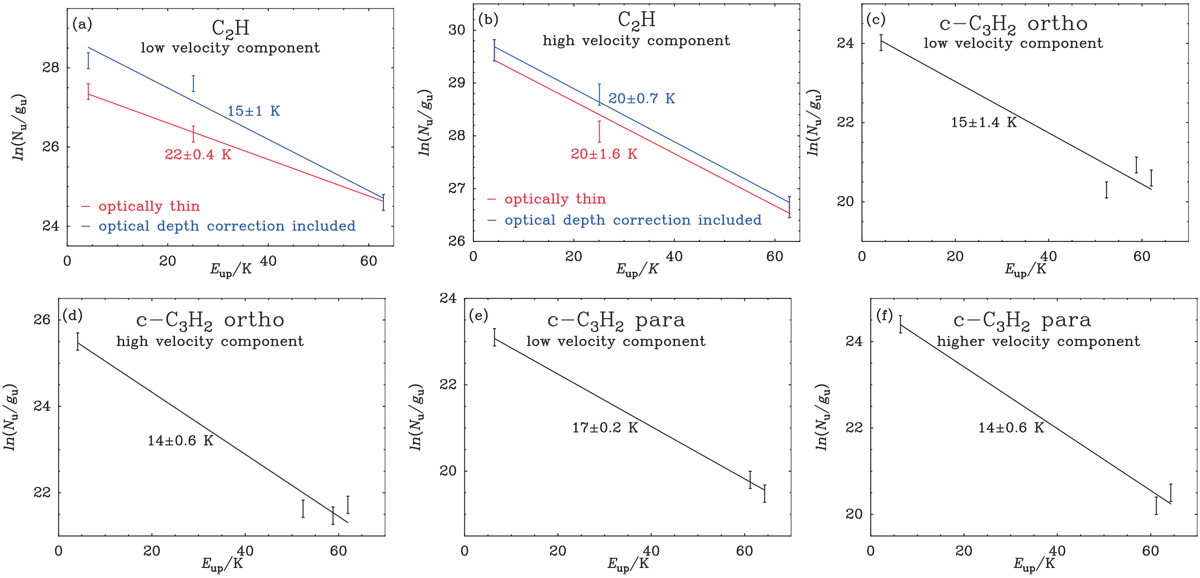
Rotational diagrams of various transitions of the N = 1 → 0, 3 → 2, and 5 → 4 transitions of C2H (top row); J = 2 → 1, 6 → 5, 7 → 6, and 8 → 7 transitions of ortho c-C3H2 (top and bottom rows); and J = 2 → 1, 7 → 6, and 8 → 7 transitions of para c-C3H2 (bottom row) observed toward Her 36. For C2H, rotational diagrams are plotted with an assumption of optically thin C2H (in red) andincluding the optical depth correction factors (in blue). Fitted values of rotational temperatures are given for each molecule. The error bars were calculated from the maximum noise of the integrated intensities of individual transitions and from calibration uncertainties of 20%.
Current usage metrics show cumulative count of Article Views (full-text article views including HTML views, PDF and ePub downloads, according to the available data) and Abstracts Views on Vision4Press platform.
Data correspond to usage on the plateform after 2015. The current usage metrics is available 48-96 hours after online publication and is updated daily on week days.
Initial download of the metrics may take a while.