Fig. 4
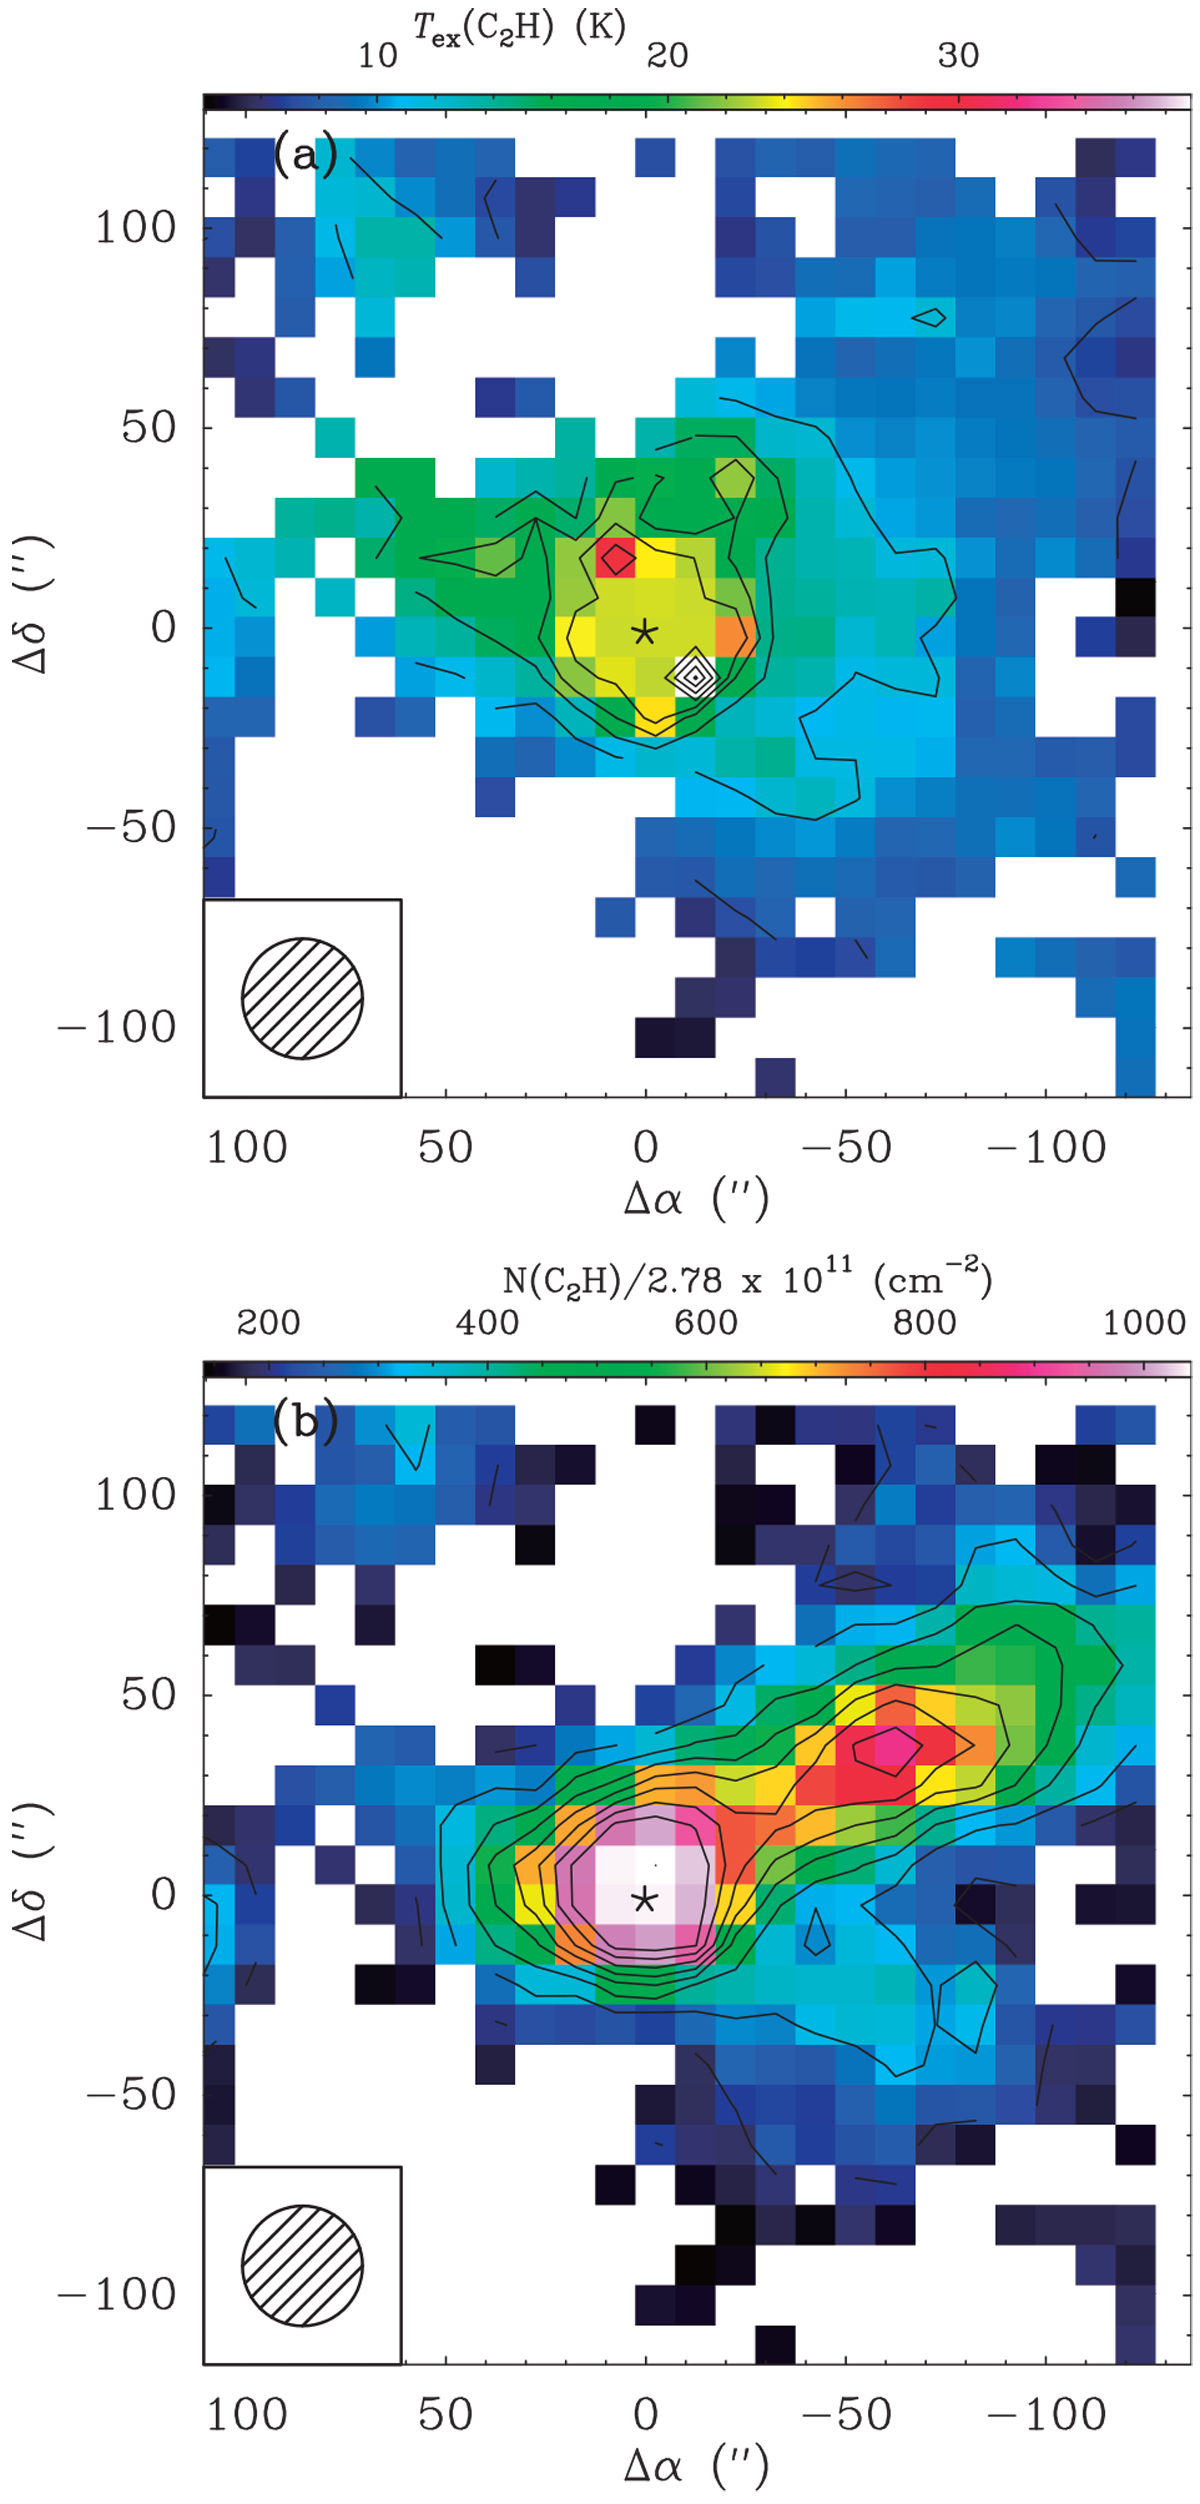
Upper panel: excitation temperature defining the populations of N = 1 and 3 levels. Lower panel: total column density of C2H. The asterisk represents Her 36, which is the central position (Δα = 0, Δδ = 0) at RA (J2000) = 18h03m40.3s and Dec (J2000) = –24°22′43′′. The contour levels are 10–100% in steps of 10% of the corresponding peak emissions. The values of main beam brightness temperatures and that of the velocity integrated intensities for the N = 1 and 3 levels used to calculate the Tex(C2H) and N(C2H) were extracted from maps convolved to the same resolution of 30′′.
Current usage metrics show cumulative count of Article Views (full-text article views including HTML views, PDF and ePub downloads, according to the available data) and Abstracts Views on Vision4Press platform.
Data correspond to usage on the plateform after 2015. The current usage metrics is available 48-96 hours after online publication and is updated daily on week days.
Initial download of the metrics may take a while.