Fig. 3
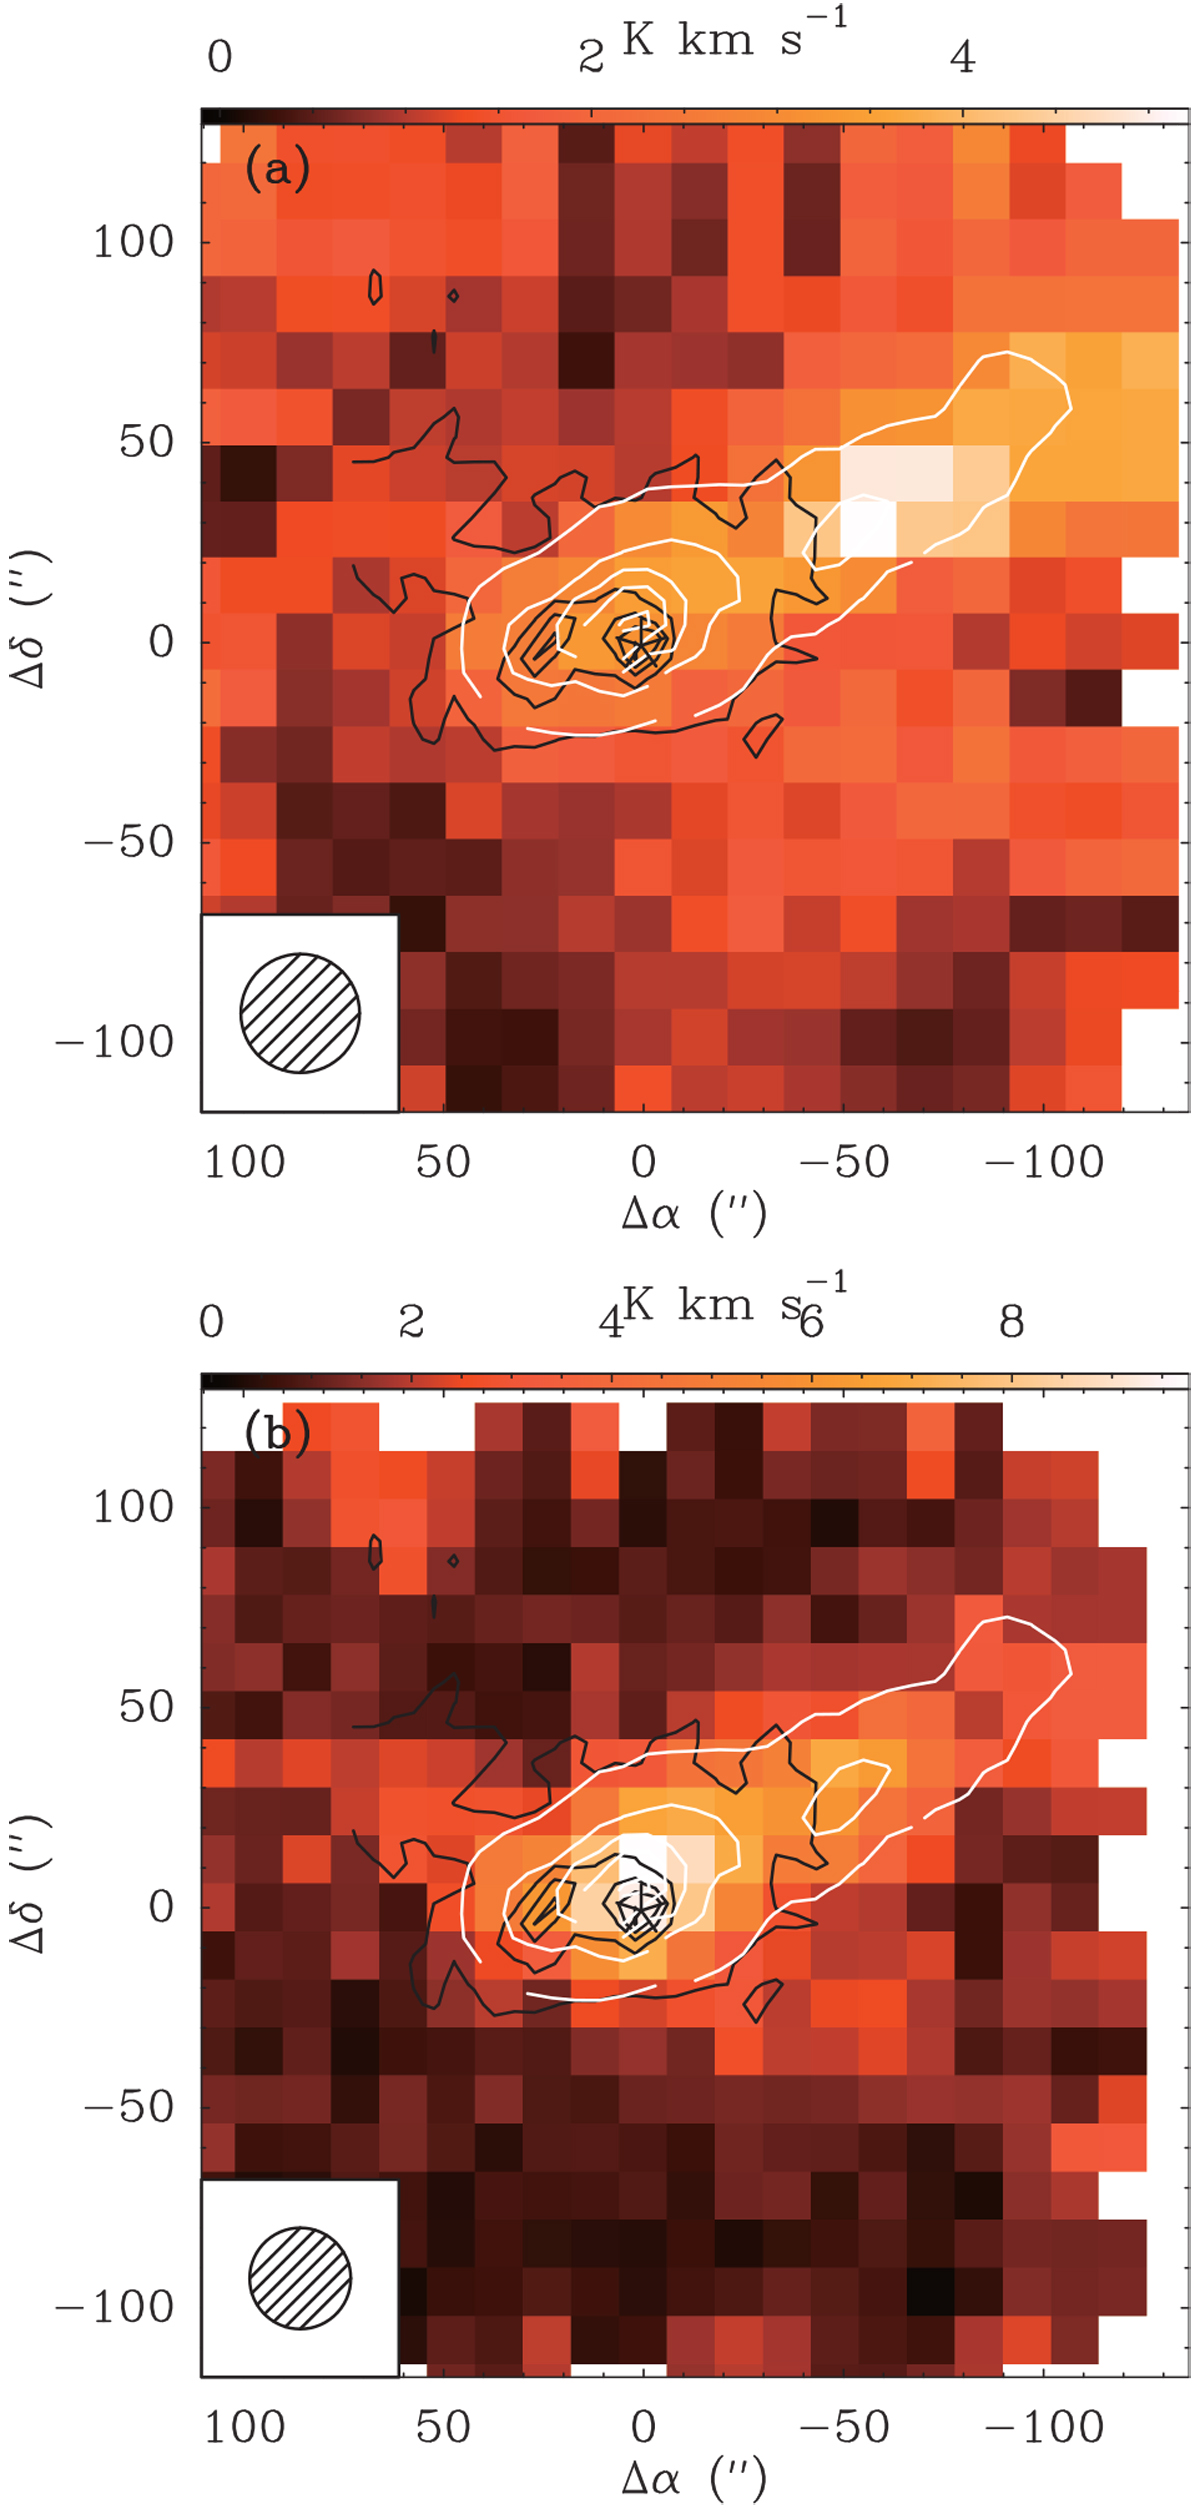
Color maps of the velocity integrated intensity of the: upper panel: N = 1 → 0 and lower panel: 3 → 2 transitions of C2H toward Her 36, which is the central position (Δα = 0, Δδ = 0) at RA (J2000) = 18h03m40.3s and Dec (J2000) = –24°22′43′′, marked with an asterisk. Both maps are plotted using original beam sizes shown in the bottom left of each map. These maps are overlaid with contours of GLIMPSE 8 μm continuum emission in black, with a beam size of 0.6′′ and with contours of SPIRE 250 μm continuum emission in white, with a beam size of 17.9′′. For GLIMPSE 8 μm continuum emission, the contour levels are 10 to 100% in steps of 20% of the peak emission and for SPIRE 250 μm continuum emission, the contour levels are 10 to 100% in steps of 10% of the peak emission.
Current usage metrics show cumulative count of Article Views (full-text article views including HTML views, PDF and ePub downloads, according to the available data) and Abstracts Views on Vision4Press platform.
Data correspond to usage on the plateform after 2015. The current usage metrics is available 48-96 hours after online publication and is updated daily on week days.
Initial download of the metrics may take a while.