Fig. C.1
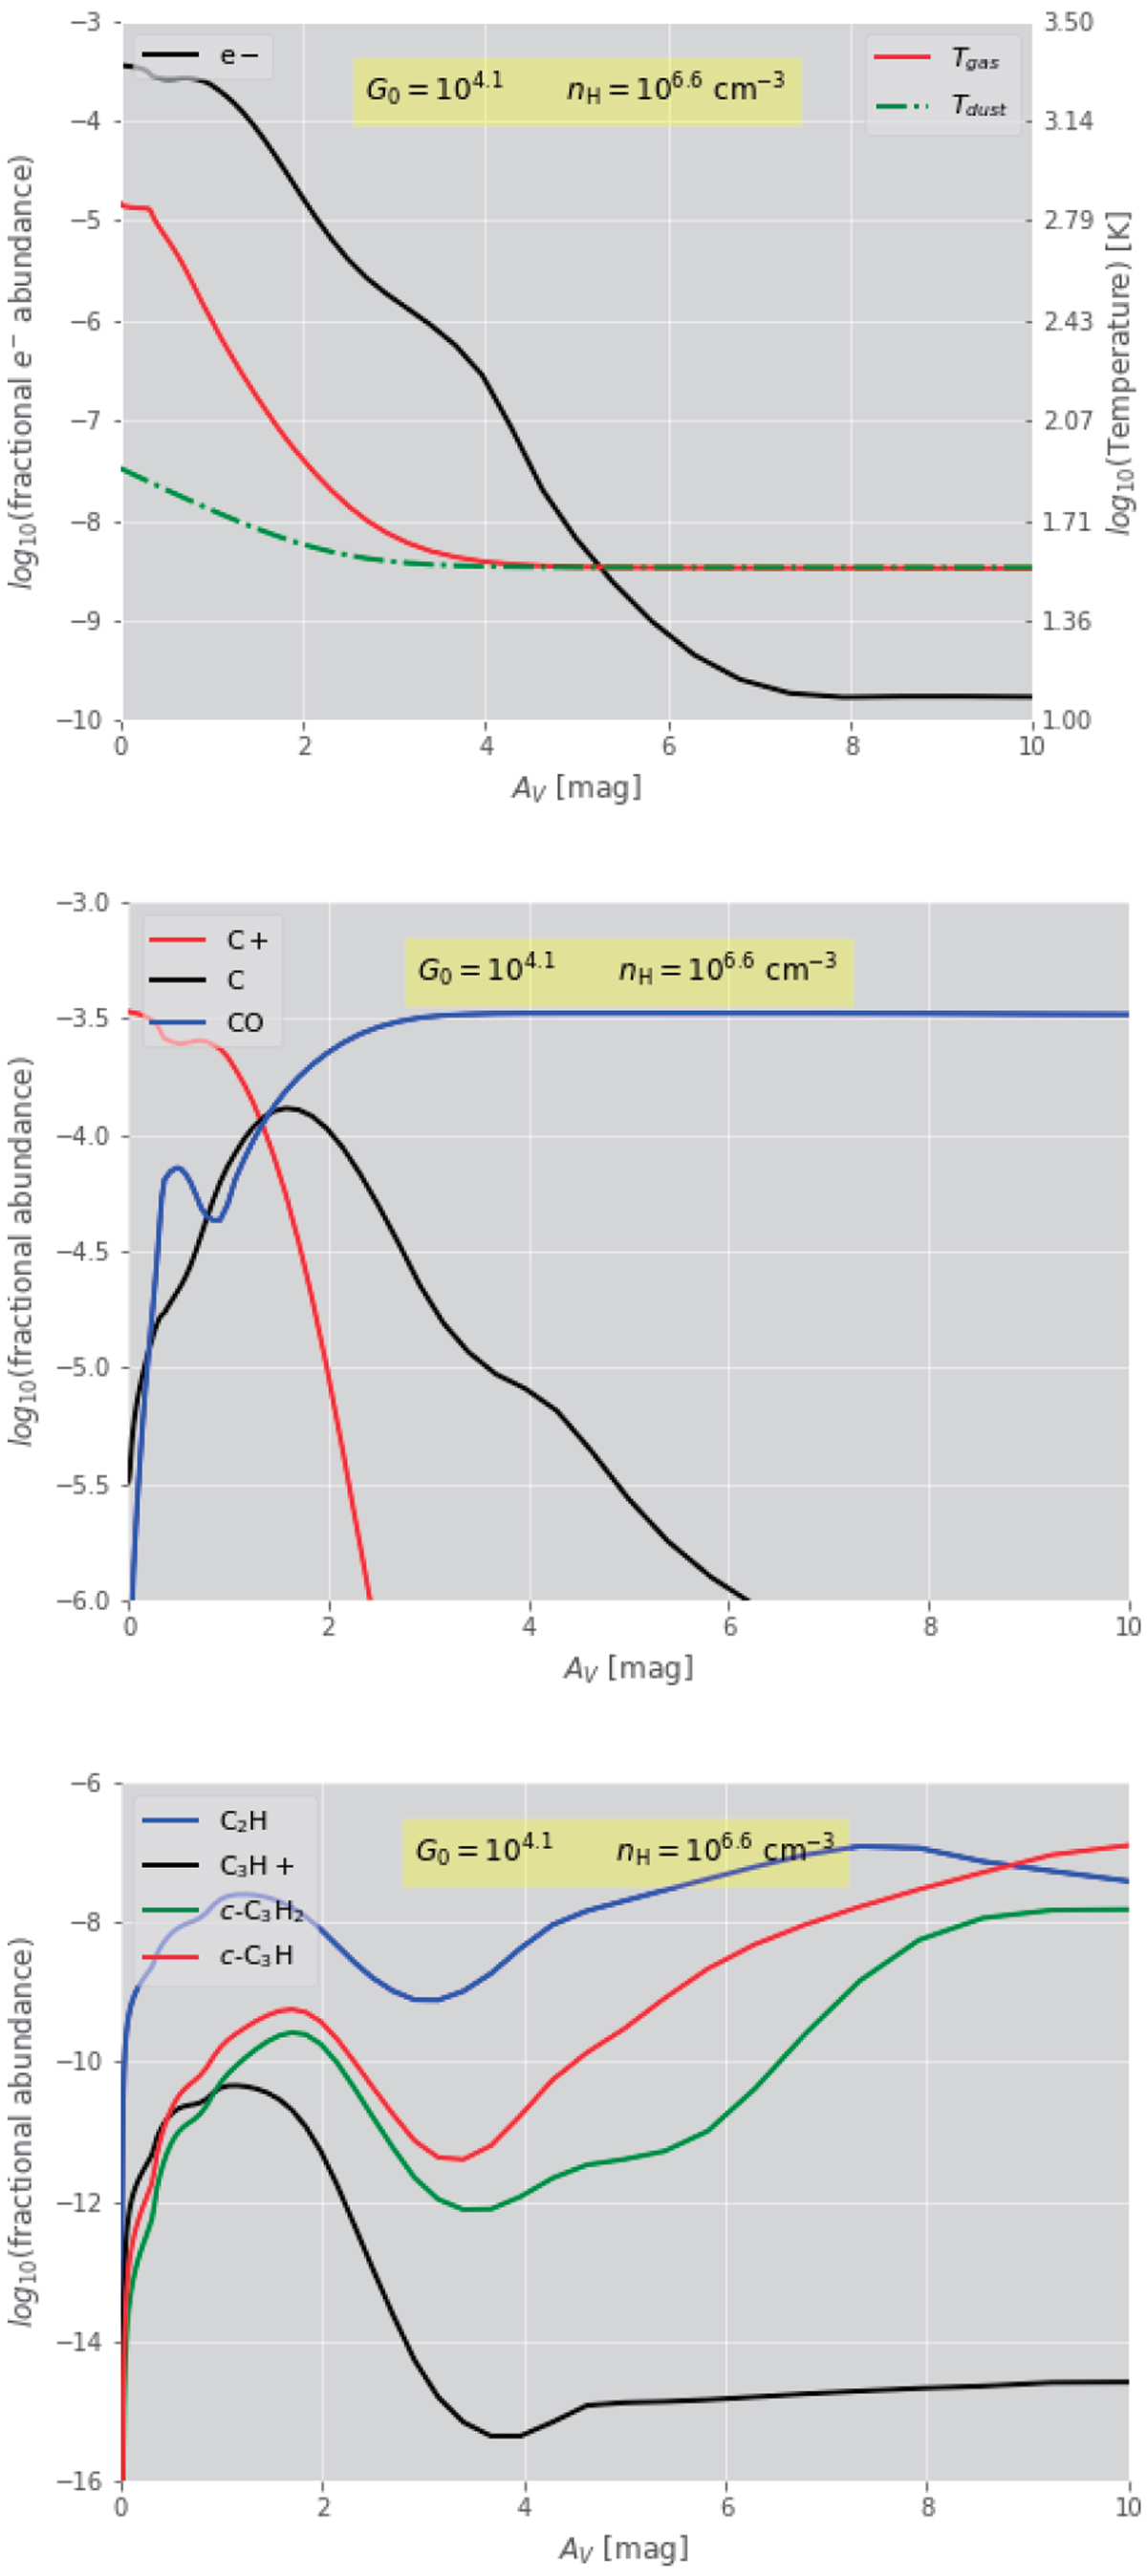
Results of our PDR modeling for a high density clump in the Orion Bar (nH = 4 × 106 cm−3 and G0 = 1.17 × 10⁴). In all panels, the abscissa gives visual extinction. Top panel: dependence of the electron abundance (black solid line/ left ordinate), gas temperature (red solid line/ right ordinate), and dust temperature (red line, green dash-dot/ right ordinate). Middle panel: fractional abundances of ionized and neutral carbon and CO as red, black, and blue lines, respectively. Bottom panel: fractional abundances of C2H, C2 H+, c-C3 H2, and c-C3H as ionized and neutral carbon and CO as blue, black, green, and red lines, respectively.
Current usage metrics show cumulative count of Article Views (full-text article views including HTML views, PDF and ePub downloads, according to the available data) and Abstracts Views on Vision4Press platform.
Data correspond to usage on the plateform after 2015. The current usage metrics is available 48-96 hours after online publication and is updated daily on week days.
Initial download of the metrics may take a while.