Free Access
Fig. 8.
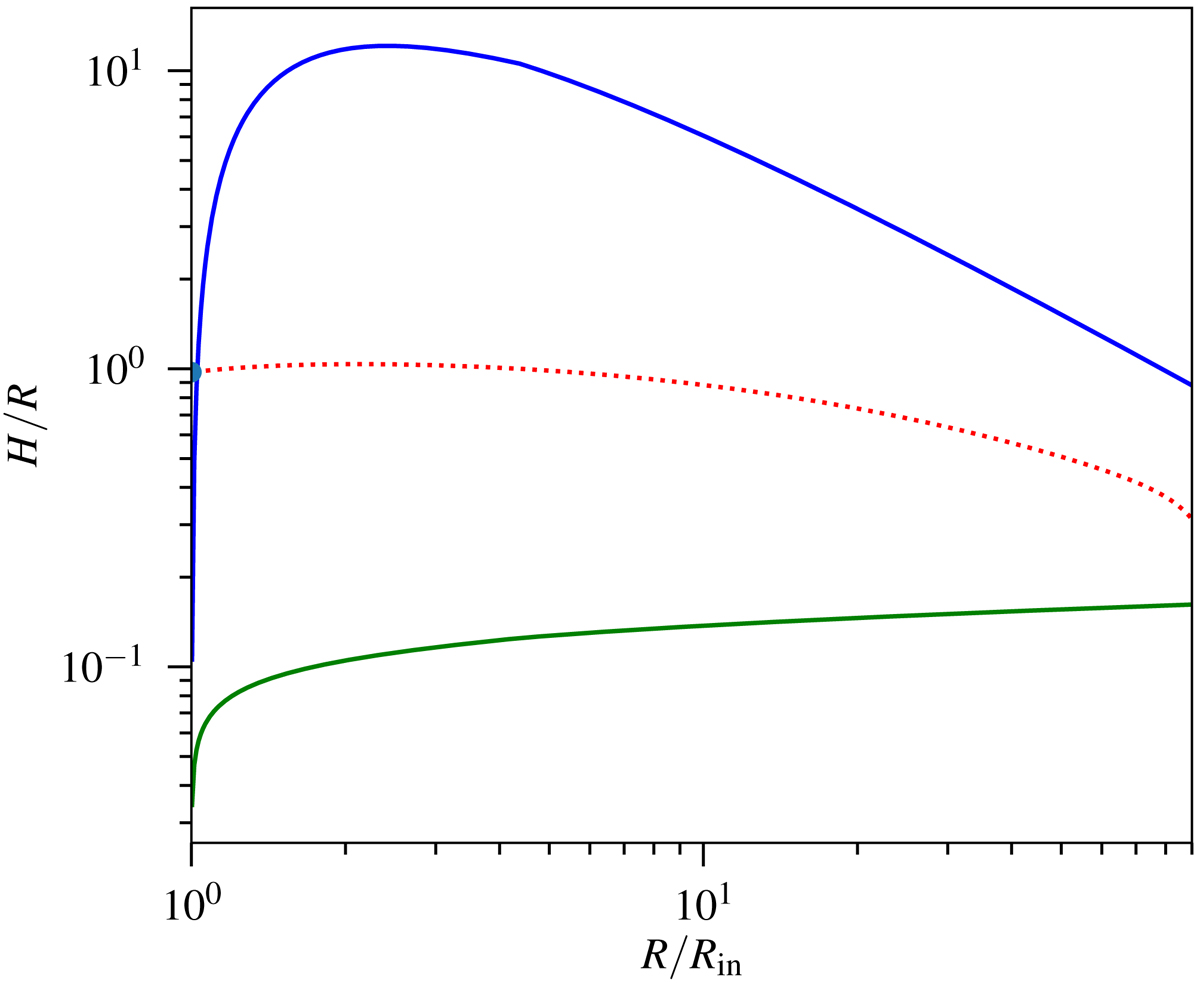
Relative disc thickness as a function of the radius for a model with μ = 1030 G cm3, ṁ0 = 3 × 10³, and p = 0.67 s. Our results are shown by the red dotted curve, whereas the solid green and blue curves correspond to the asymptotics for the zones B and A of the standard disc, respectively.
Current usage metrics show cumulative count of Article Views (full-text article views including HTML views, PDF and ePub downloads, according to the available data) and Abstracts Views on Vision4Press platform.
Data correspond to usage on the plateform after 2015. The current usage metrics is available 48-96 hours after online publication and is updated daily on week days.
Initial download of the metrics may take a while.