Fig. 9
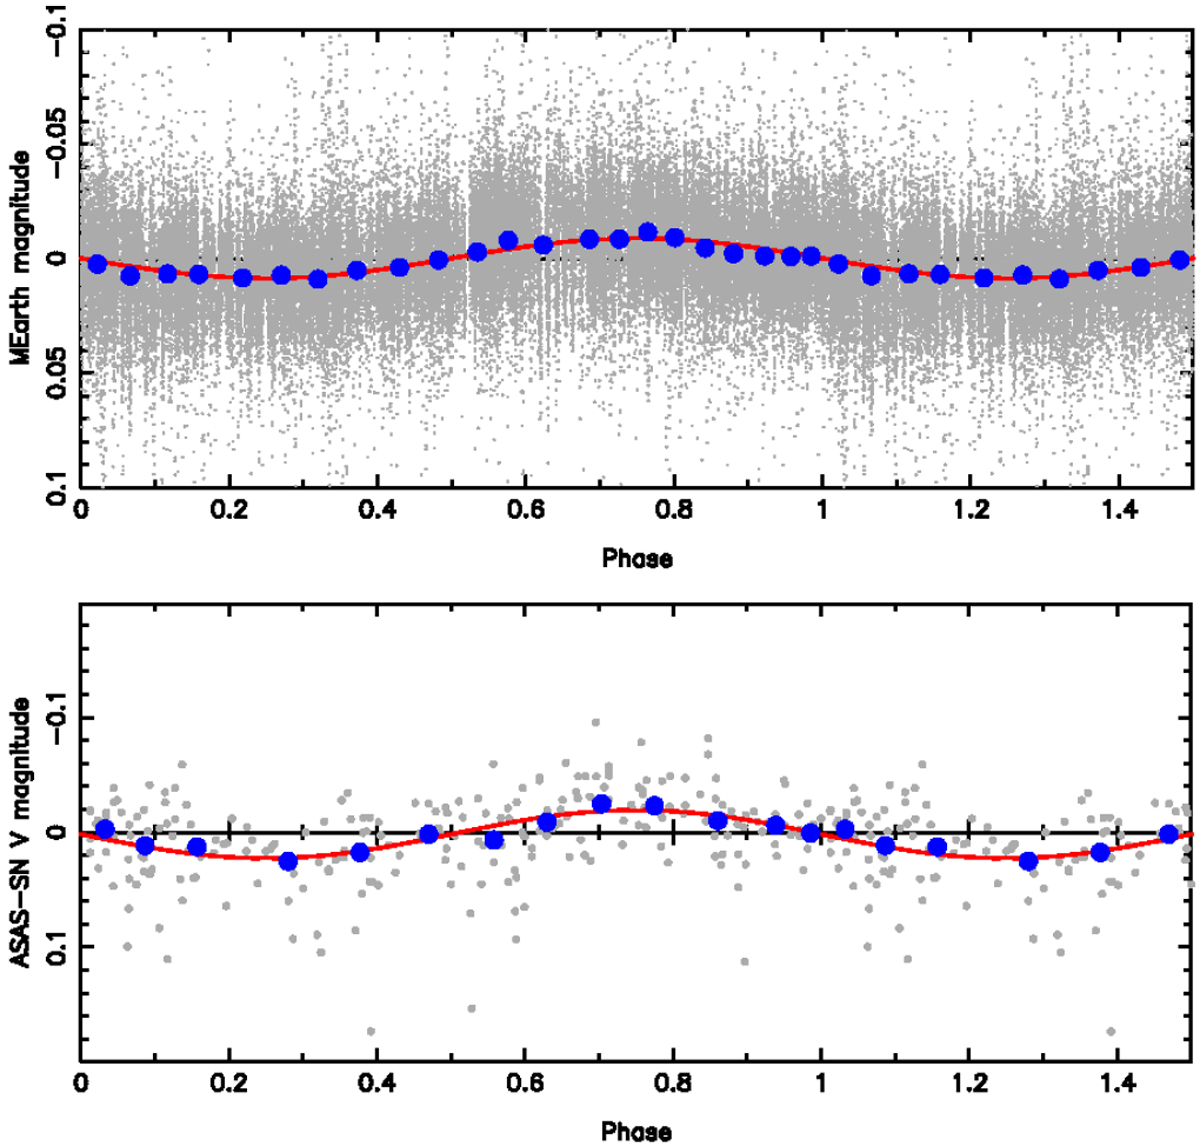
MEarth DR7 (top) and ASAS-SN (bottom) light curves (grey dots) folded with a period of 91.0 and 96.5 d, respectively.The sinusoid fit to the data is shown with the red curve (amplitudes of 8.7 and 21.0 mmag). Each blue dot corresponds to the average of 3000 MEarth and 19 ASAS-SN individual data points. We note that the vertical scale is different by a factor of two different between the two panels.
Current usage metrics show cumulative count of Article Views (full-text article views including HTML views, PDF and ePub downloads, according to the available data) and Abstracts Views on Vision4Press platform.
Data correspond to usage on the plateform after 2015. The current usage metrics is available 48-96 hours after online publication and is updated daily on week days.
Initial download of the metrics may take a while.