Free Access
Fig. 8
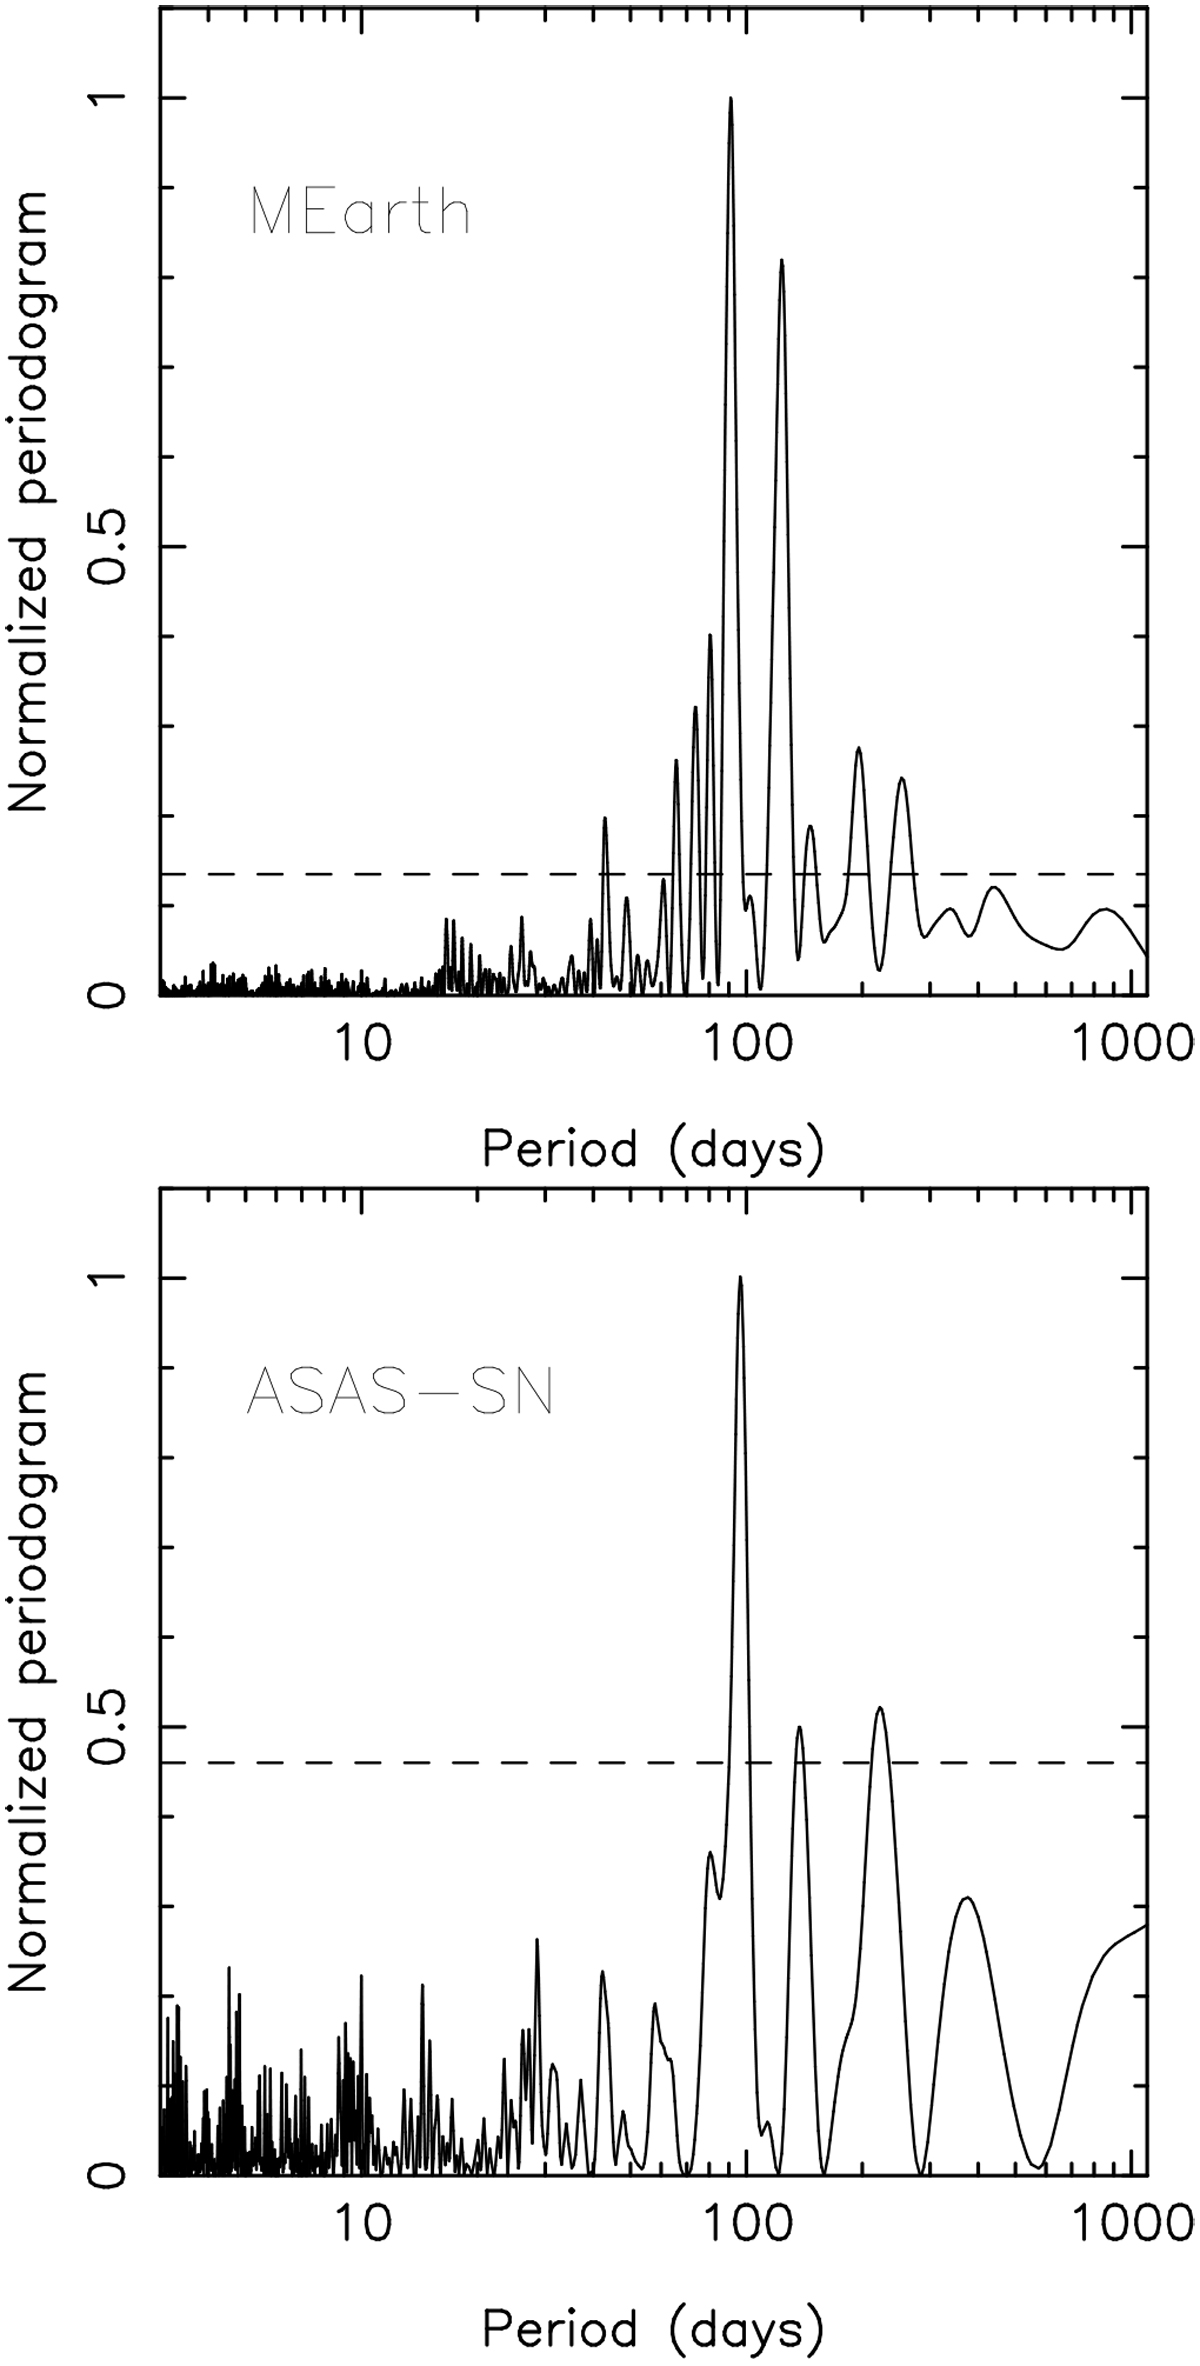
Top: Lomb-Scargle periodogram of the MEarth DR7 light curve for Proxima Cen. Bottom: Lomb-Scargle periodogram of the ASAS-SN light curve for Proxima Cen after subtraction of the decreasing flux trend. The 0.1% FAP is indicated by the horizontal dashed lines.
Current usage metrics show cumulative count of Article Views (full-text article views including HTML views, PDF and ePub downloads, according to the available data) and Abstracts Views on Vision4Press platform.
Data correspond to usage on the plateform after 2015. The current usage metrics is available 48-96 hours after online publication and is updated daily on week days.
Initial download of the metrics may take a while.