Fig. 7
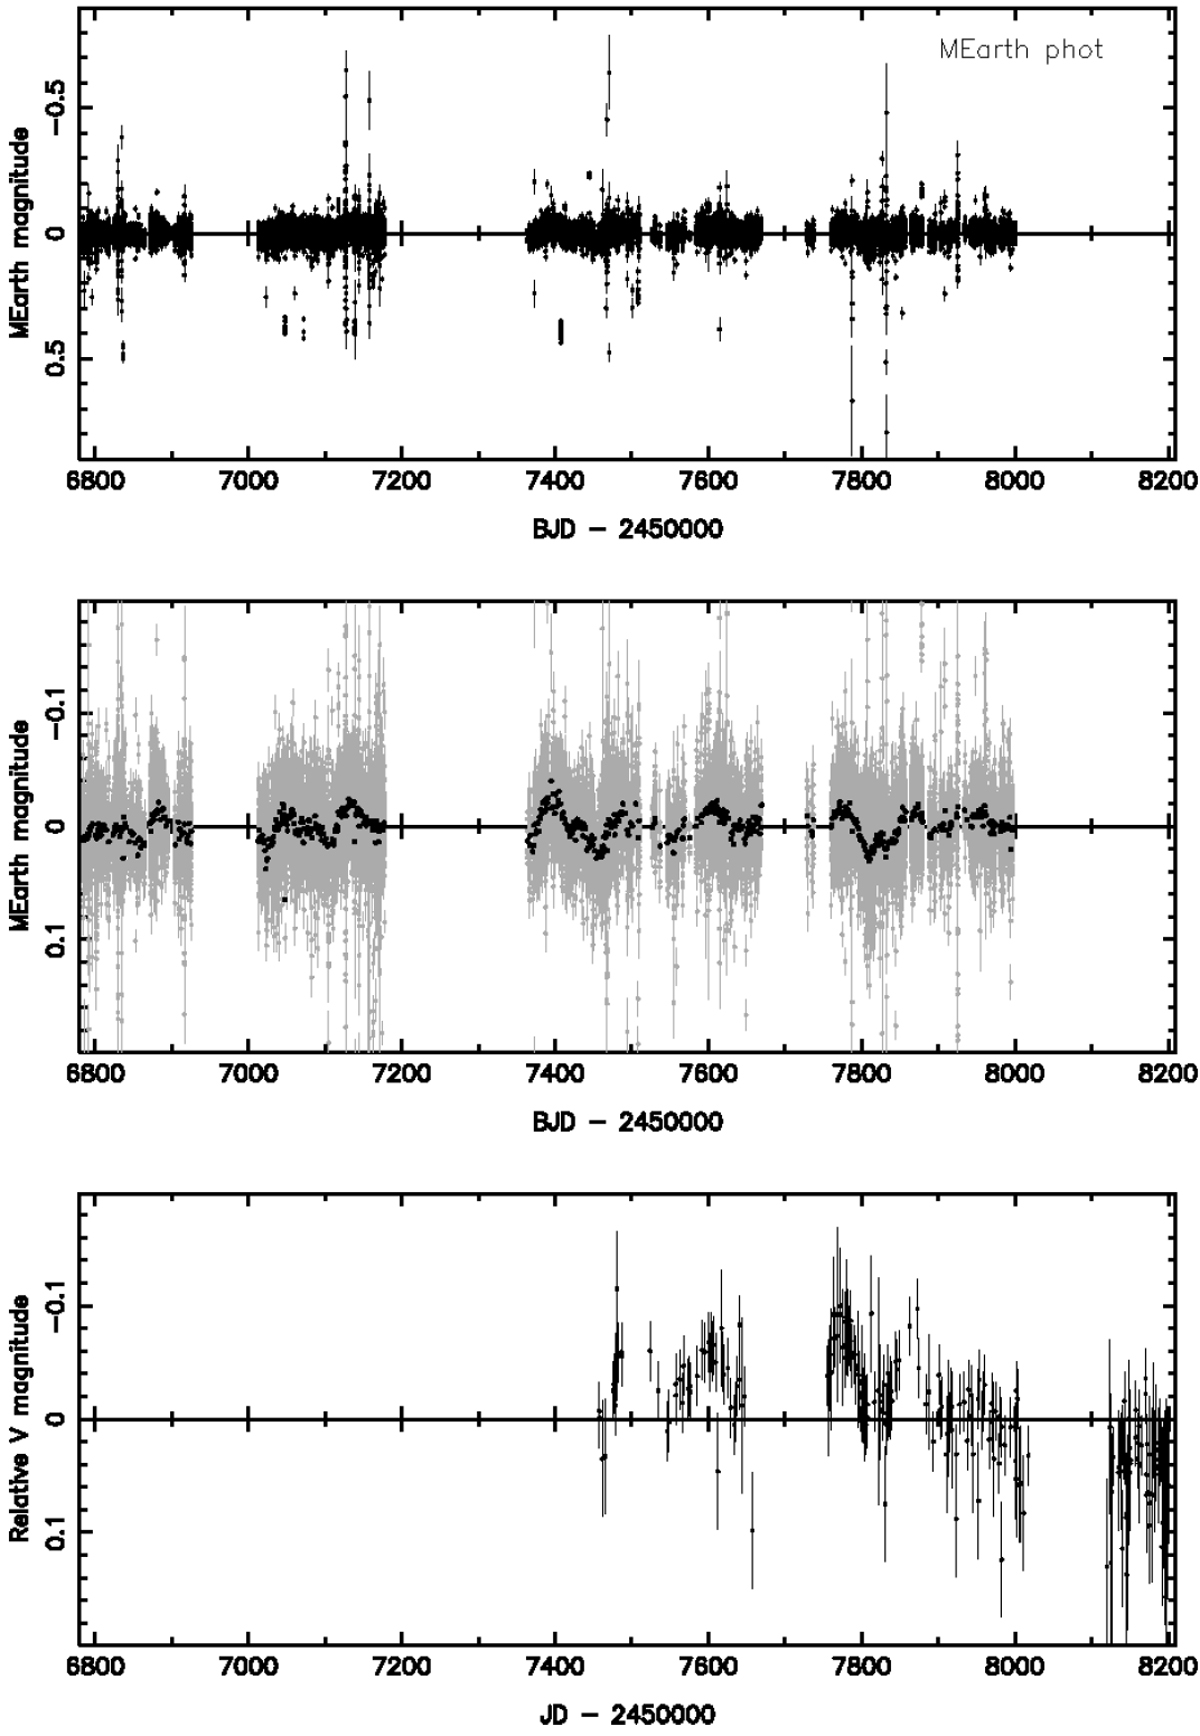
Top: Proxima Cen photometric light curve (filter RG715) delivered by MEarth DR7 (black dots). The data span a period of 3.2 yr. Negative magnitude simply brighter states of the star. Middle: enlargement of the MEarth DR7 light curve. Original data are plotted as grey dots. The day-averaged photometry is shown with black dots. Bottom: ASAS-SN light curve (black dots) spanning a time period of 2 yr. The mean magnitude of 11.227 mag has been subtracted from the original data for a proper comparison with the MEarth DR7 light curve.
Current usage metrics show cumulative count of Article Views (full-text article views including HTML views, PDF and ePub downloads, according to the available data) and Abstracts Views on Vision4Press platform.
Data correspond to usage on the plateform after 2015. The current usage metrics is available 48-96 hours after online publication and is updated daily on week days.
Initial download of the metrics may take a while.