Fig. 6
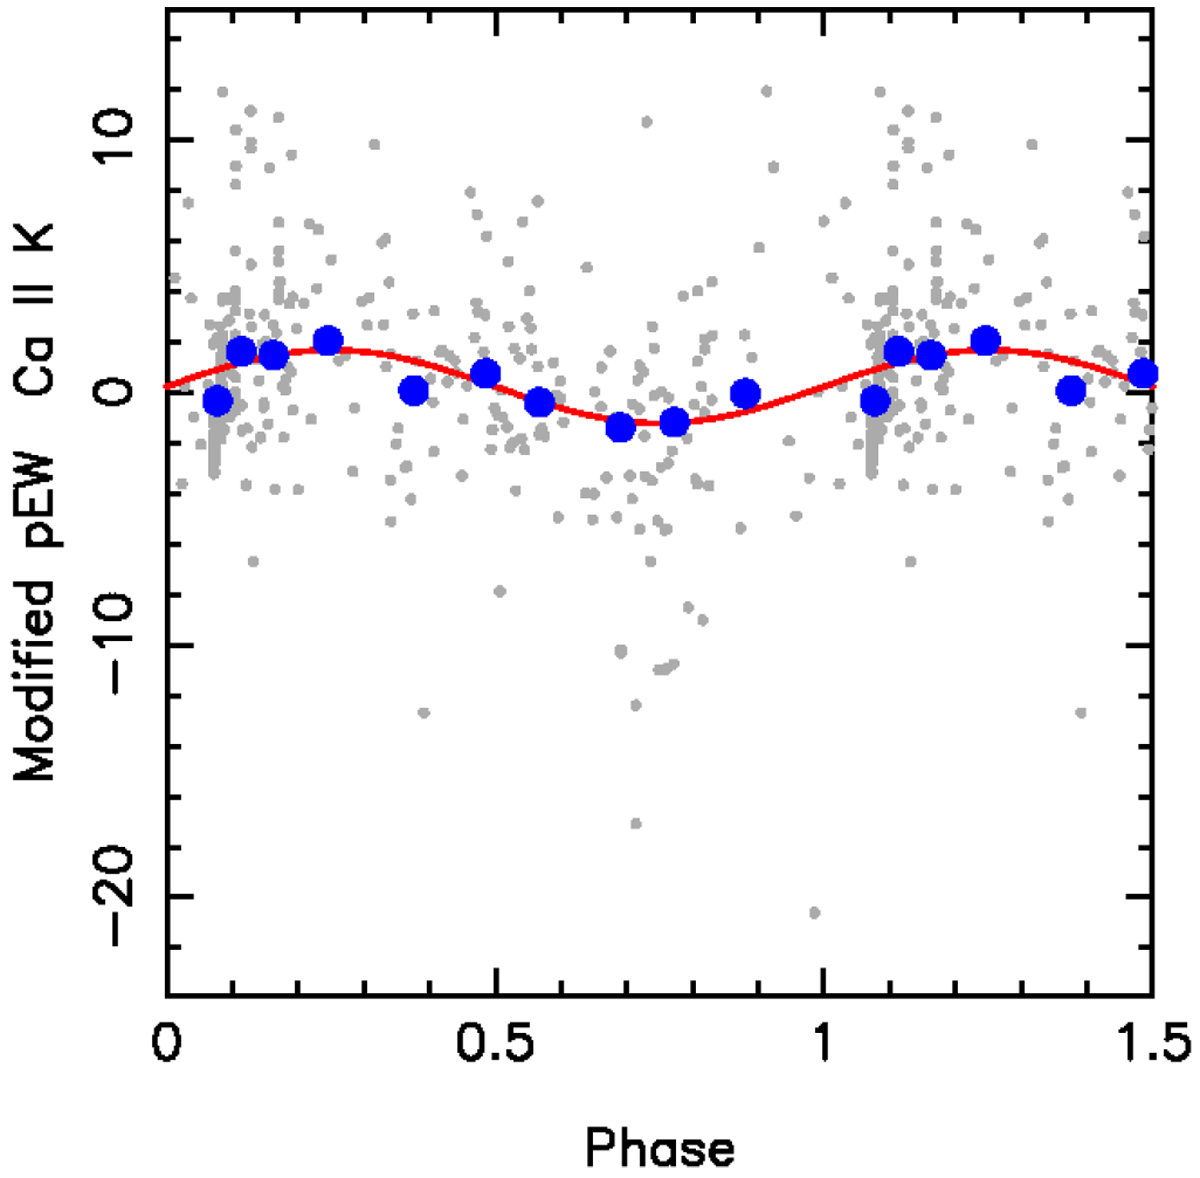
Median-subtracted pEWs of the CaII K line (grey dots) folded in phase with the period of 90.72 days. The red line depicts the sinusoidal fit to the folded data (amplitude of 1.5 Å), and the blue dots correspond to the data points averaged with their 21 neighbours. Flares and strongly deviant data points are not included in the diagram.
Current usage metrics show cumulative count of Article Views (full-text article views including HTML views, PDF and ePub downloads, according to the available data) and Abstracts Views on Vision4Press platform.
Data correspond to usage on the plateform after 2015. The current usage metrics is available 48-96 hours after online publication and is updated daily on week days.
Initial download of the metrics may take a while.