Free Access
Fig. 5
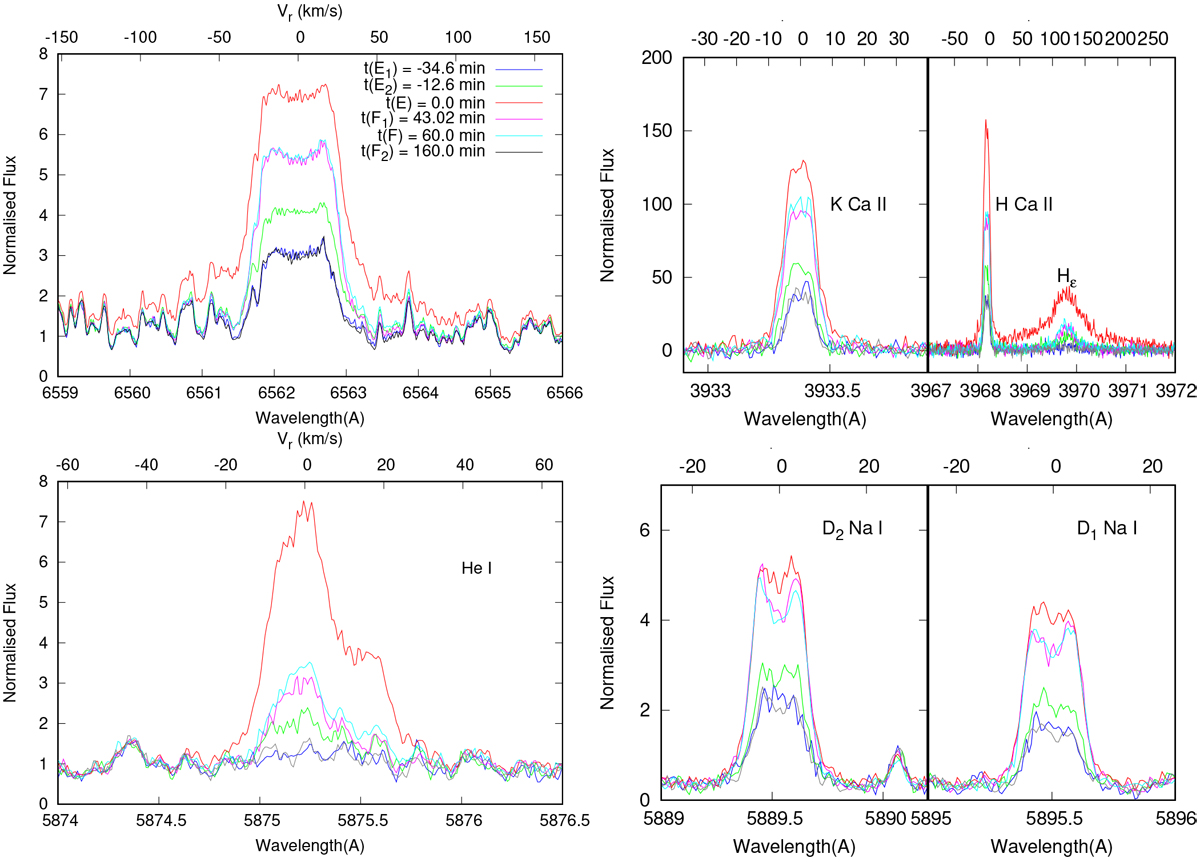
Temporal variations of the pEW of several emission lines during the flare on the night of BJD = 6417. The times depicting the different phases are marked at the top of the top-left panel showing changes in the strength of Hα.
Current usage metrics show cumulative count of Article Views (full-text article views including HTML views, PDF and ePub downloads, according to the available data) and Abstracts Views on Vision4Press platform.
Data correspond to usage on the plateform after 2015. The current usage metrics is available 48-96 hours after online publication and is updated daily on week days.
Initial download of the metrics may take a while.