Fig. 3
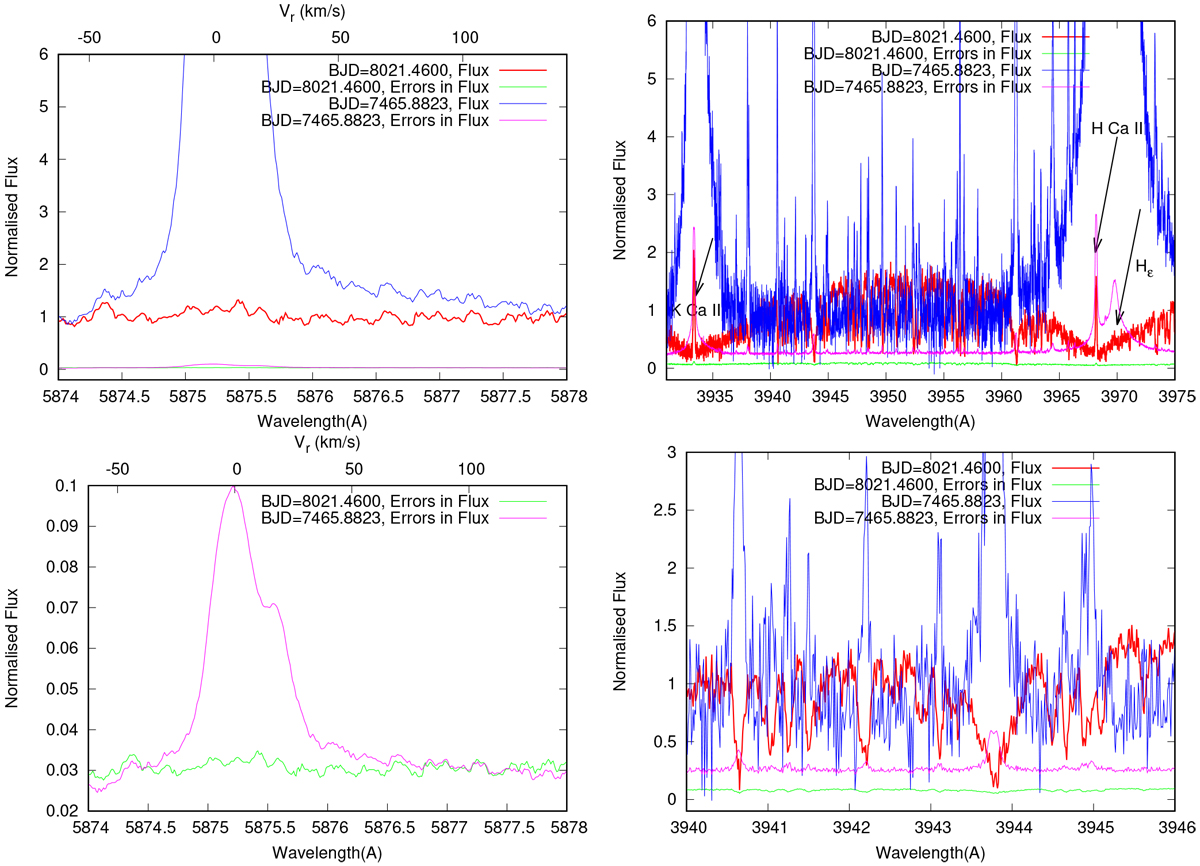
Top-left panel: observed fluxes of emission lines across He5876 spectral region at the dates of minimum and maximum activity, shown by red and blue lines, respectively. Uncertainties of the flux determination are shown by the green and pink colours, respectively. Bottom-left panel: uncertainties of the flux determinations at the phases of minimum and maximum activity shown in larger scale. Top-right panel: observed fluxes of emission lines across CaII H and K and Hɛ spectral regions at the same dates of minimum and maximum activity, shown by red and blue lines, respectively. Bottom-right panel: part of the observed spectra shown in larger scale. Flux measurement uncertainties are also shown.
Current usage metrics show cumulative count of Article Views (full-text article views including HTML views, PDF and ePub downloads, according to the available data) and Abstracts Views on Vision4Press platform.
Data correspond to usage on the plateform after 2015. The current usage metrics is available 48-96 hours after online publication and is updated daily on week days.
Initial download of the metrics may take a while.