Fig. 2
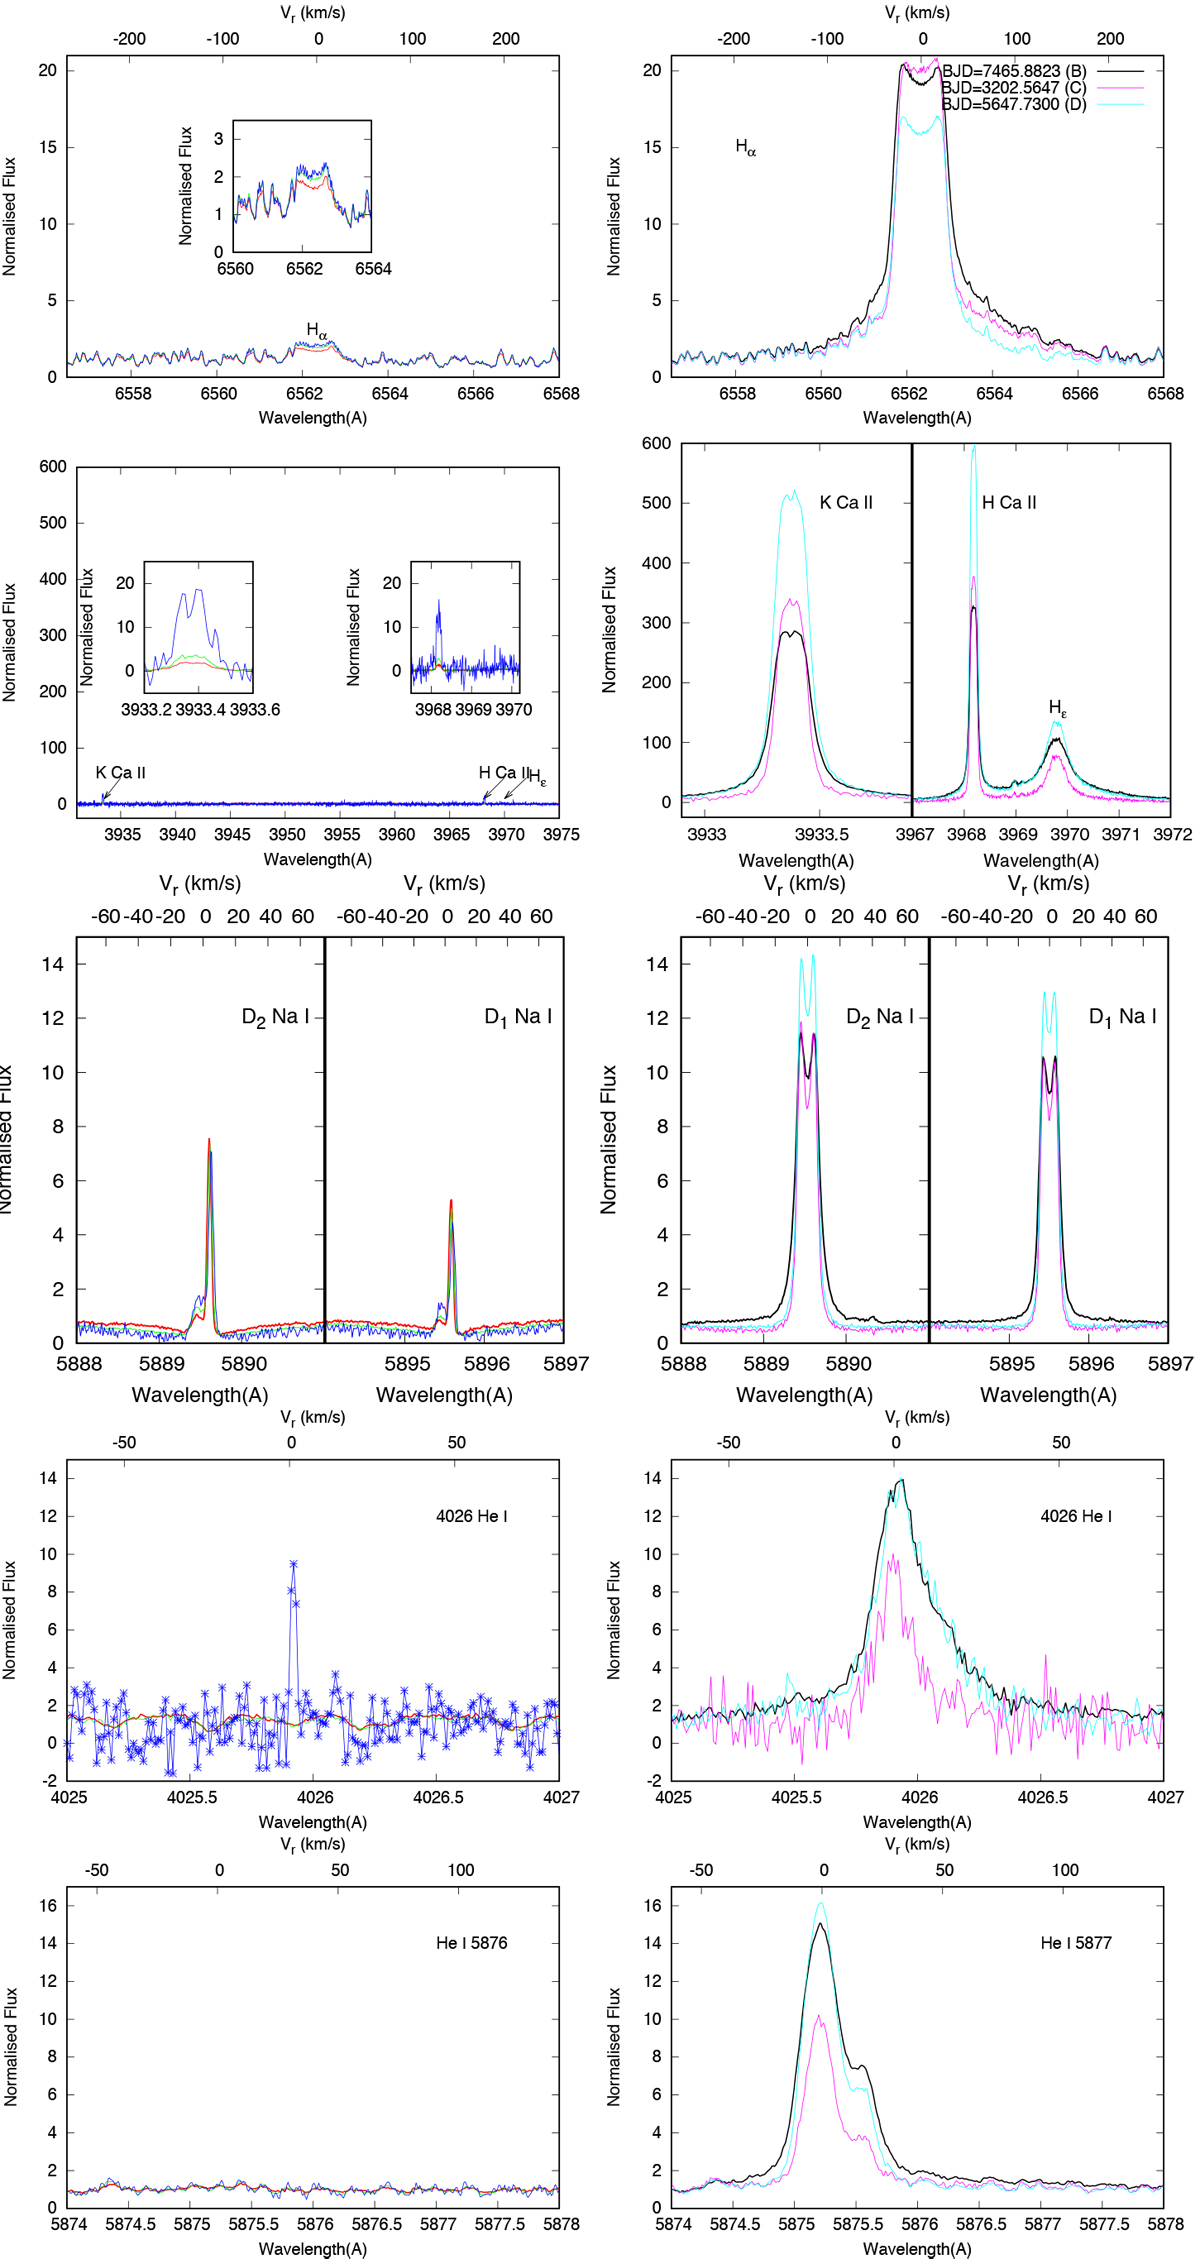
Left panels: profiles of several emission lines, including Hα, CaII K and H, NaI D2 and D1, He5876, and He4026 at the three dates of minimum activity of Proxima Cen: BJD = 8021.4600 (red), 8023.4639 (green), and 8027.4785 (blue). These dates are marked with letter “A” in Fig. 1. Right panels: same lines at the dates of maximum of activity of Proxima Cen, i.e. BDJ = 7465.8823 (B; black), 3202.5647 (C; cyan), 5647.7300 (D; magenta) displayed in Fig. 1.
Current usage metrics show cumulative count of Article Views (full-text article views including HTML views, PDF and ePub downloads, according to the available data) and Abstracts Views on Vision4Press platform.
Data correspond to usage on the plateform after 2015. The current usage metrics is available 48-96 hours after online publication and is updated daily on week days.
Initial download of the metrics may take a while.