Fig. 1
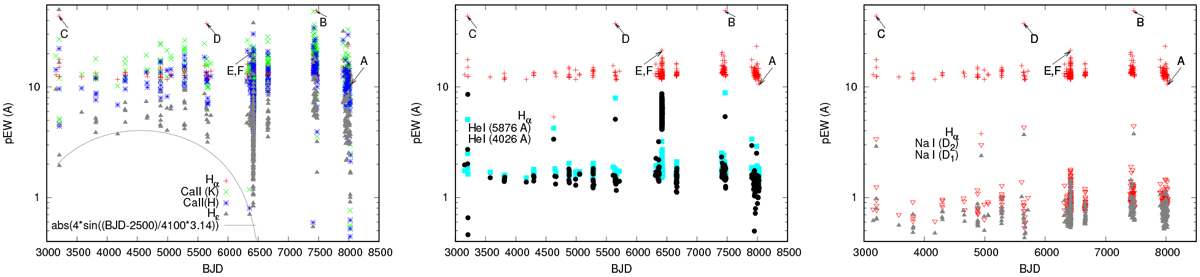
Variations of pEW of emission lines at all dates of observations. The letter “A” marks the absolute minimum of the pEW of Hα (Sect. 4.4), letters “B”, “C” and “D” label the flares occasionally observed at BJD = 7465.8823, 3202.5647, and 5647.7300, respectively (Sect. 4.4) and letters “E” and “F” label the pEW of two Hα flares observed across BJD = 6417 (Sect. 4.2). Grey line shows the approximation of the set of minimum values of pEW of Hɛ by a sinusoid; see Sect. 4.1.
Current usage metrics show cumulative count of Article Views (full-text article views including HTML views, PDF and ePub downloads, according to the available data) and Abstracts Views on Vision4Press platform.
Data correspond to usage on the plateform after 2015. The current usage metrics is available 48-96 hours after online publication and is updated daily on week days.
Initial download of the metrics may take a while.