Fig. 9.
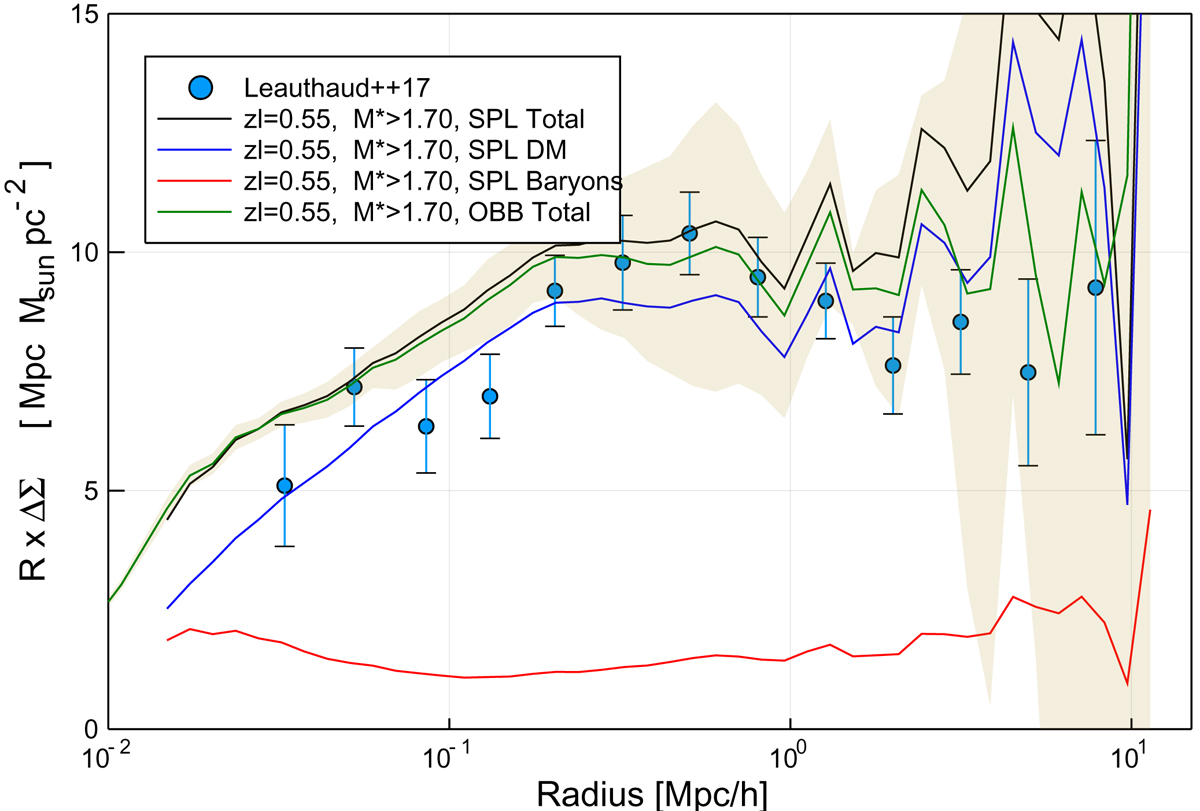
Comparison of the GGL tangential shear signal around z = 0.55 Horizon-AGN galaxies (green curve surrounded by a light green ribbon) and the GGL observations of Leauthaud et al. (2017) (blue dots with error bars). Units are all physical (and not comoving!). Model uncertainties in the simulation past lightcone are roughly estimated by splitting the 2.25 deg wide field of view into four quadrants. They may be underestimated beyond 1 h−1 Mpc. Cuts in stellar mass are expressed in units of 1011 M⊙. Black, blue, and red curves show the GGL shear signal predicted with the SPL method for the total, DM, and baryonic mass distributions, respectively. For clarity, uncertainties are omitted. They are similar to those in the case of the OBB method (green).
Current usage metrics show cumulative count of Article Views (full-text article views including HTML views, PDF and ePub downloads, according to the available data) and Abstracts Views on Vision4Press platform.
Data correspond to usage on the plateform after 2015. The current usage metrics is available 48-96 hours after online publication and is updated daily on week days.
Initial download of the metrics may take a while.