Fig. 7.
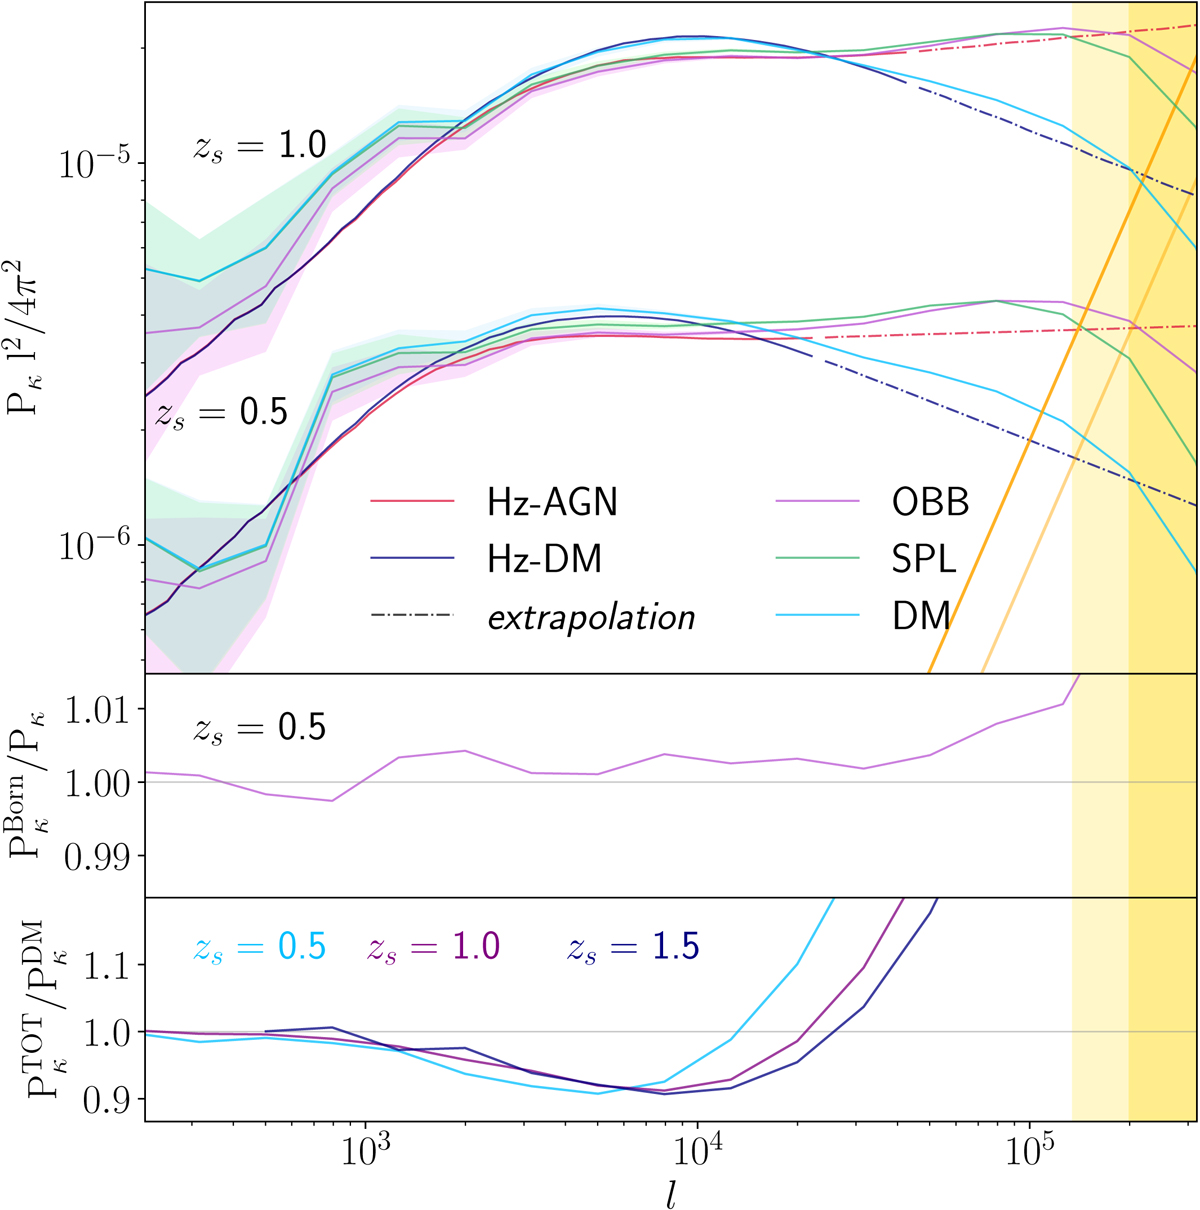
Upper panel: convergence power spectra for source redshift zs = 1 (top) and zs = 0.5 (bottom) derived with the OBB (magenta) and the SPL (green) methods. The more aggressive smoothing of this latter method translates into a faster high-ℓ fall-off. The cyan curves (DM) only account for the DM component (rescaled by 1 + Ωb/ΩM). The red curve corresponds to the direct integration of the three-dimensional total matter power spectrum (Limber approximation) in the Horizon-AGN simulation (Hz-AGN). The blue curves are the direct integration of the Horizon-DM (DM-only) matter power spectrum (Hz-DM). Dashes reflect regimes where the three-dimensional spectra of Chisari et al. (2018) were extrapolated by a simple power law (extrapolation). The yellow lines show the particle shot-noise contribution at two different redshifts. Middle panel: ratio of the zs = 0.5 convergence power spectra obtained with the Born approximation and the proper multiple lens plane integration showing only very small changes up to ℓ ∼ 105. Bottom panel: ratio of the DM-only to total convergence power spectra at zs = 0.5, 1.0, and 1.5 for the SPL method.
Current usage metrics show cumulative count of Article Views (full-text article views including HTML views, PDF and ePub downloads, according to the available data) and Abstracts Views on Vision4Press platform.
Data correspond to usage on the plateform after 2015. The current usage metrics is available 48-96 hours after online publication and is updated daily on week days.
Initial download of the metrics may take a while.